Figures & data
Figure 1. The structure of bersaldegenin-1,3,5-orthoacetate.
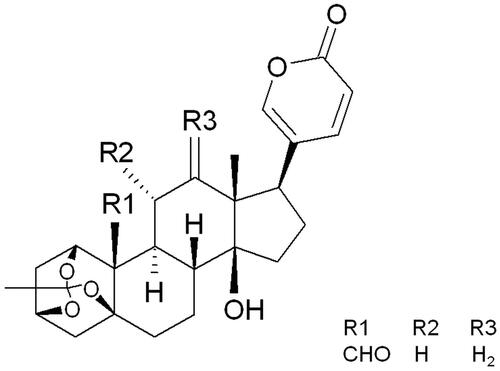
Figure 2. The RTCA viability profiles of HeLa cells treated with bersaldegenin-1,3,5-orthoacetate. The cells were treated with the compound in a concentration range of 0.1–20.0 µg/mL for 24 h. DMSO was added to the cells (a control sample) at a concentration of 0.25% (v/v). (A) The profiles of HeLa cells proliferation, (B) IC50 values calculated during 24 h of treatment the cells with the compound. All the profiles were obtained by RTCA software v.1.2.1.
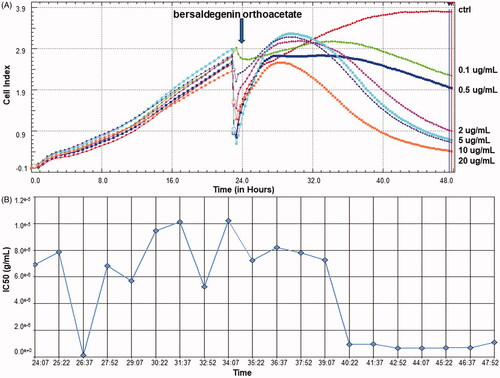
Figure 3. The nuclei of HeLa cells stained with Hoechst 33342 dye after 24 h of treatment with bersaldegenin-1,3,5-orthoacetate. (A–D) show the cells under an inverted light microscope, (E–L) – under a fluorescent microscope. The cells were treated with DMSO (0.25%) – a control sample (A, E, I) and the bersaldegenin at concentrations of 0.5 (B, F, J), 1.0 (C, G, K), and 2.0 μg/mL (D, H, L). White arrows indicate Hoechst strongly positive nuclei. The images were done at 100× (A–H) and 400× magnification (I–L), respectively.
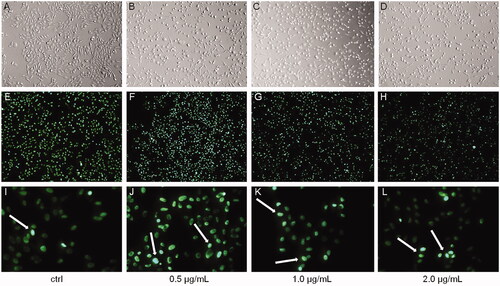
Figure 4. The effect of bersaldegenin-1,3,5-orthoacetate on ROS generation in HeLa cells. The cells were treated with the compound at concentrations of 0.1–5.0 µg/mL. The ROS negative (ROS−) and ROS positive (ROS+) cells were assessed by flow cytometry and determined in comparison to the control sample (0.25% DMSO). A–E show ROS level in HeLa cells treated with DMSO (A, the control) and the bersaldegenin at concentrations of 0.5 (B), 1.0 (C), 2.0 (D), and 5.0 µg/mL (E). (F) – presents the percentage of each cell population after 24 h of treatment the cells with the compound. Each sample was run in triplicate. Error bars indicate standard deviations. Significant differences relative to the control are marked with an ‘*’ (p < 0.05).
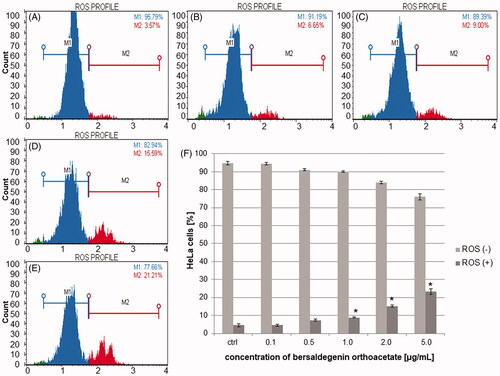
Figure 5. The effect of bersaldegenin-1,3,5-orthoacetate on MMP in HeLa cells. The cells were treated with the compound at concentrations 0.1–5.0 µg/mL and DMSO (a control sample). After 3 h (A), 24 h (B), and 48 h (C) the cells were stained and analysed by flow cytometry. The percentage of live, depolarized/live, depolarized/dead and dead cells was determined in comparison to the control sample. Each sample was run in triplicate. Error bars represent standard deviations. Significant differences relative to the control are marked with an asterisk ‘*’ (p < 0.05).
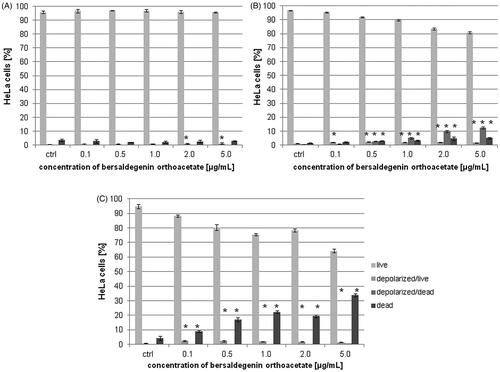
Figure 6. The relative activity of caspase-9 in HeLa cells after treatment with bersaldegenin-1,3,5-orthoacetate. The cells were incubated with the compound at concentrations of 0.1–5.0 µg/mL for 1–24 h. The caspase activity was estimated by luminometer and is presented in comparison to the control (0.25% DMSO). Each sample was run in triplicate. Error bars indicate standard deviations. Significant differences relative to the control are marked with an ‘*’ (p < 0.05).
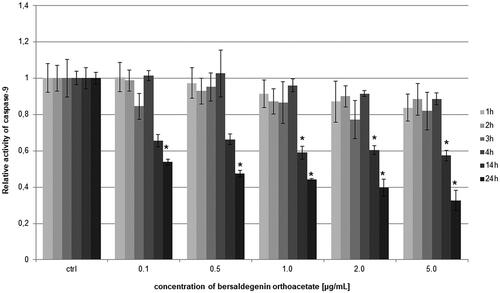
Figure 7. The activity of caspase-3/7 in HeLa cells after treatment with bersaldegenin-1,3,5-orthoacetate. The cells were treated with the compound at concentrations of 0.1–5.0 µg/mL for 24 h and 48 h. The caspase activity was estimated by flow cytometry and the graph presented live, apoptotic, and dead cell populations in comparison to the control (0.25% DMSO) after 24 h (A) and 48 h (B) of treatment. C–F present the effect of DMSO (C) and the compound (0.5 (D), 2.0 (E), 5.0 µg/mL (F), respectively) on HeLa cells after 48 h of treatment. Each sample was run in triplicate. Error bars indicate standard deviations. Significant differences relative to the control are marked with an ‘*’ (p < 0.05).
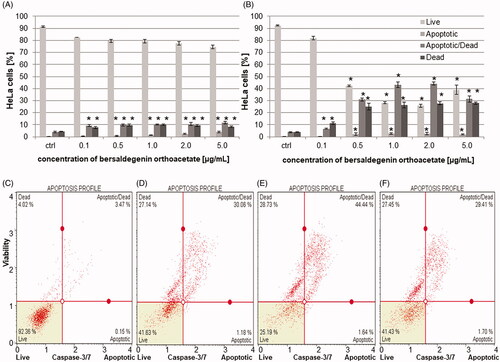
Figure 8. Induction of DNA damage by bersaldegenin-1,3,5-orthoacetate in HeLa cells. Cells were treated with concentrations of 1.0 and 5.0 μg/mL for 6 and 24 h. The extent of DNA damage was compared to control cells. (A–F) represent images of DNA damage induced in HeLa cells treated with DMSO (A) and the compound 1.0 µg/mL (B), 5.0 µg/mL (C) for 6 h and DMSO (D) and the compound 1.0 µg/mL (E), 5.0 µg/mL (F) for 24 h. DNA damage was analysed with the comet assay and defined as tail moment (G). Results are means of (± SD) of three repetitions. Significant differences between control and treated samples are indicated with an ‘*’ (p < 0.05).
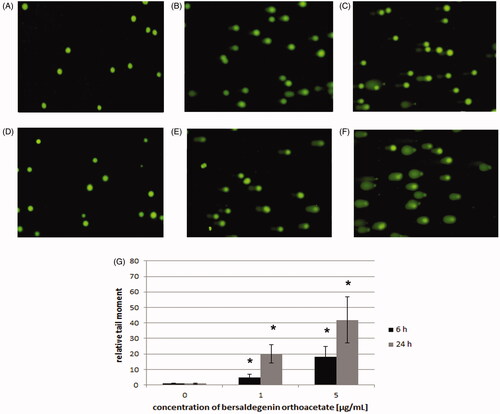
Figure 9. Bersaldegenin-1,3,5-orthoacetate induced phosphorylation of H2A.X in HeLa cells nuclei. DMSO (0.25% v/v, a negative control, A–C) and etoposide (10 μM, a positive control, D–F), and the compound were added to the cells at concentrations of 1.0 (G–I) and 5.0 μg/mL (J–L) for 24 h. (M) and (N) show HeLa nuclei after 6 h of incubation with the bersaldegenin compound at concentrations of 1 μg/mL (M) and 5 μg/mL (N). The nuclei were stained with Hoechst 33342 dye (A, D, G, J, M, N) and anti-phospho-H2A.X (Ser139) Alexa Fluor 555 conjugate antibody (B, E, H, K, M, N). Arrows indicate γH2A.X foci signals visible in the nuclei. The graph shows the γH2A.X nuclei (%) with high fluorescence signal in the controls and the treated HeLa cells. The experiment was repeated twice. Error bars indicate standard deviations. Significant differences relative to the control are marked with an ‘*’ (p < 0.05). The images were done with a fluorescence microscope at 100× and 630× magnification.
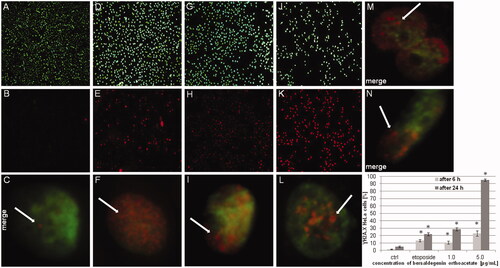
Figure 10. The effect of bersaldegenin-1,3,5-orthoacetate on cell cycle in HeLa cells after 48 h of treatment. The cells were treated with DMSO (A) and the compound at concentrations of 0.1-5.0 μg/mL (0.5 (B), 1.0 (C), 2.0 (D), and 5.0 µg/mL (E), respectively) and analysed by flow cytometry. The percentage of the cells in each phase was determined in comparison to the control (0.25% DMSO) (F). The experiment was repeated three times, independently. Error bars represent standard deviations. Significant differences relative to the control are marked with an asterisk ‘*’ (p < 0.05).
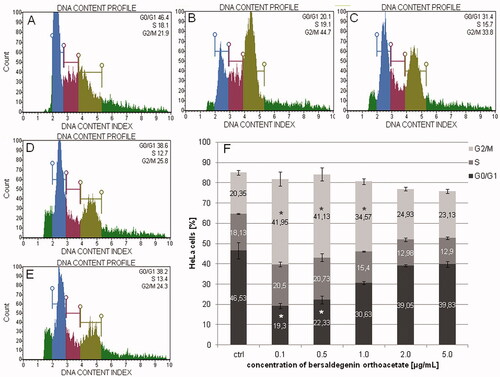
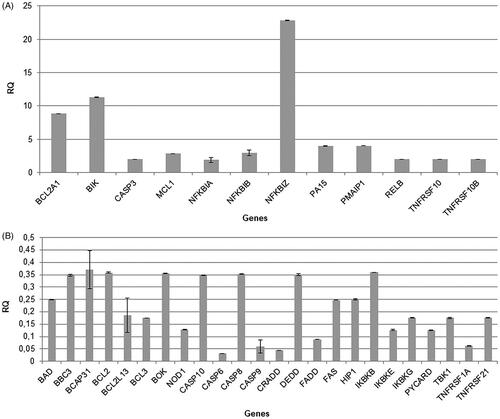
Figure 11. Bersaldegenin-1,3,5-orthoacetate induced changes in the expression of genes in HeLa cells. The cells were treated with 0.05% DMSO (control) and the compound at a concentration of 1.0 µg/mL for 24 h. The expression of genes was normalized to GUSB endogenous control gene and their levels are presented as a fold-change over (A) or under (B) the value 1.0 (ctrl).