Figures & data
Table 1. qRT-PCR primers and parameters.
Figure 1. Dose-dependent effects of inosine in rhesus monkeys. Data are presented as mean ± SEM, n = 5/group. *p< 0.05; **p< 0.01 vs. control monkeys.
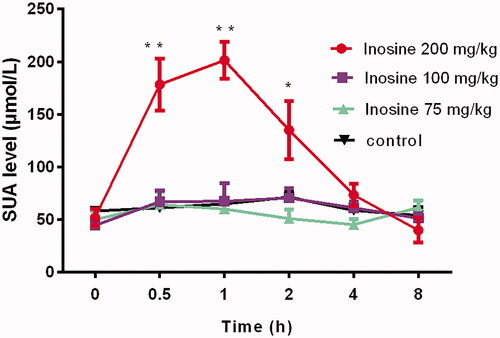
Figure 2. Activity of ulodesine and febuxostat in rhesus monkeys with acute HUA, as measured by the percentage change in SUA 0, 0.5, 1, 2, 4 and 8 h after administration. Data are presented as mean ± SEM, n = 5/group. *p< 0.05, **p< 0.01 vs. control monkeys. #p< 0.05, ##p< 0.01 vs. 200 mg/kg inosine-treated HUA monkeys.
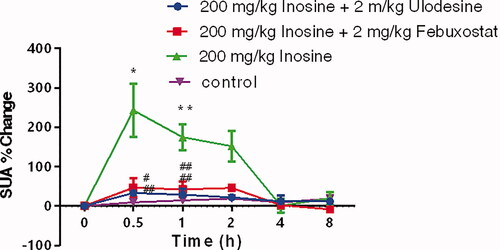
Figure 3. Activity of allopurinol in rhesus monkeys with acute HUA. Data are presented as mean ± SEM, n = 5/group. **p< 0.01 vs. control monkeys. ##p< 0.01 vs. 200 mg/kg inosine-treated HUA monkeys.
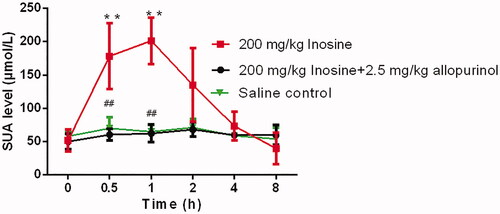
Figure 4. Reverse transcription-qPCR analysis of PNP and XO in the liver tissues. Data are presented as mean ± SEM, n = 5/group. **p< 0.01 vs. control monkeys.
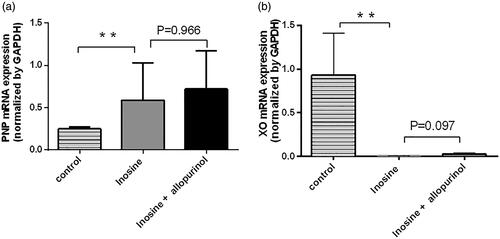
Figure 5. Western blotting of PNP and XO in the liver tissues. Data are presented as mean ± SEM, n = 5/group. **p< 0.01 vs. control monkeys.
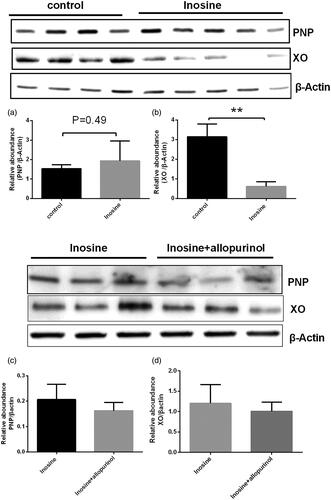
Figure 6. Reverse transcription-qPCR analysis of URAT1, GLUT9, OAT4 and ABCG2 in the kidney cortex tissues. Data are presented as mean ± SEM, n = 5/group.
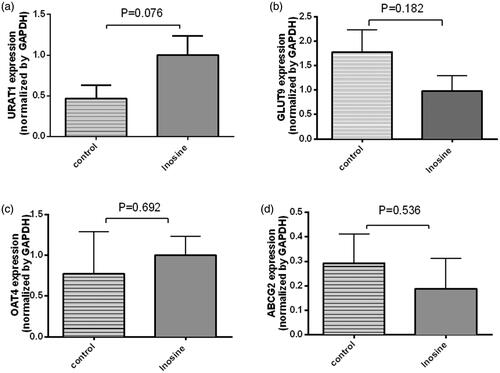
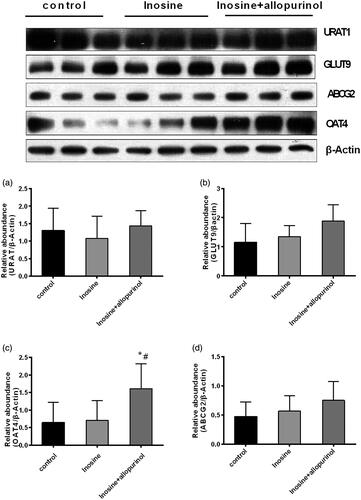
Figure 7. Western blotting analysis of URAT1, GLUT9, OAT4 and ABCG2 in the kidney cortex tissues. Data are presented as mean ± SEM, n = 5/group. #p< 0.05 vs. 200 mg/kg inosine-treated hyperuricemic monkeys. *p< 0.05 vs. control monkeys.