
Figures & data
Figure 1. Influence of evodiamine on cytokine levels in the serum (A) and BALF (B) of asthmatic rats. Values are means ± SD (n = 8); @@p < 0.01 compared to the normal group; **p < 0.01 compared to the asthma group.
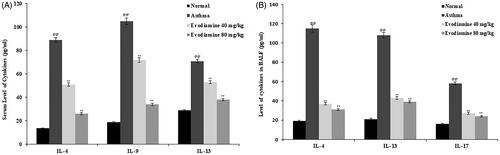
Figure 2. Evodiamine reduces the thickness of airway smooth muscle and the airway wall in intact small bronchioles of asthmatic rats. Values are means ± SD (n = 8); @@ p < 0.01 compared to the normal group; ** p < 0.01 compared to the asthma group.
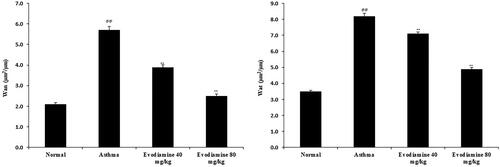
Figure 3. Effects of evodiamine on IFN-γ and IgE levels in lung tissue homogenates of asthmatic rats. Values are means ± SD (n = 8); @@p < 0.01 compared to the normal group; **p < 0.01 compared to the asthma group.
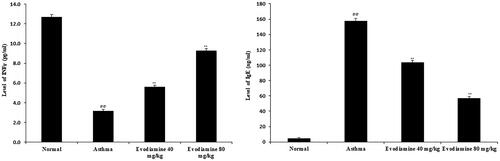
Figure 4. Effects of evodiamine on the infiltration of inflammatory cells in the BALF of asthmatic rats. Values are means ± SD (n = 8); @@p < 0.01 compared to the normal group; **p < 0.01 compared to the asthma group.
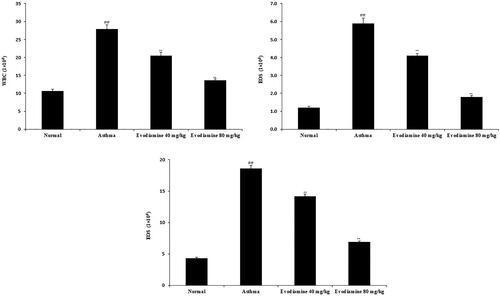
Figure 5. Immunohistochemical analyses of the expression of NF-κB protein in the lung tissue of asthmatic rats. Values are means ± SD (n = 8); @@p < 0.01 compared to the normal group; **p < 0.01 compared to the asthma group.
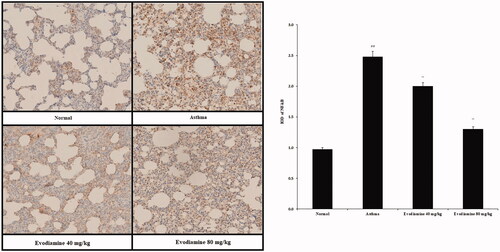
Figure 6. Expression of TLR-4, MyD88, NF-κB, and HMGB1 mRNA in the lung tissue of evodiamine-treated asthmatic rats. Values are means ± SD (n = 8); @@p < 0.01 compared to the normal group; **p < 0.01 compared to the asthma group.
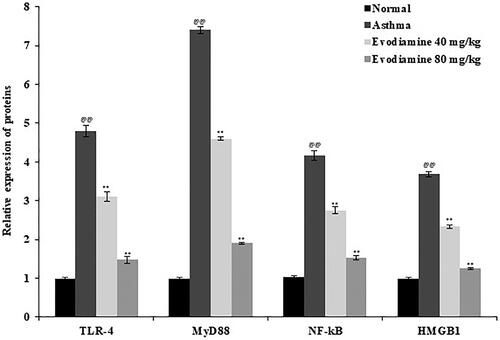
Figure 7. Histopathological changes in the lung tissue of evodiamine-treated asthmatic rats. (A) H&E staining of lung tissue and histopathological score. (B) PAS staining of lung tissue and PAS score. Values are means ± SD (n = 8); @@p < 0.01 compared to the normal group; **p < 0.01 compared to the asthma group.
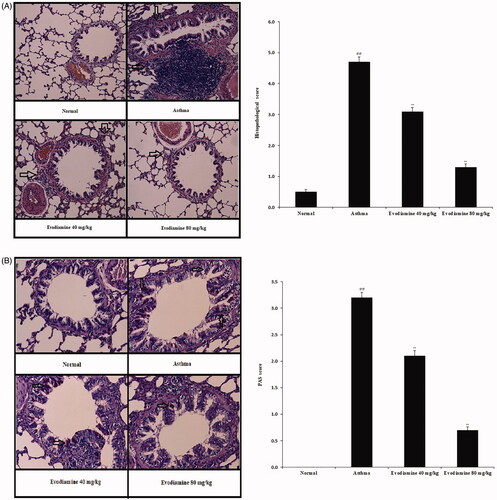
Figure 8. In silico molecular docking shows the interaction of the TLR-4 protein and evodiamine. The solid area in the protein structures represents the area of interaction.
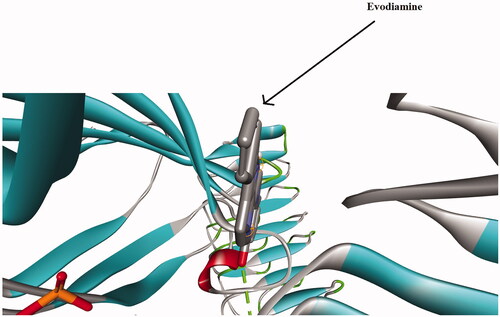
Table 1. Docking scores for TLR-4 protein with ligand molecule Evodiamine.