
Figures & data
Figure 1. The pharmacokinetic profiles of rotundic acid (RA) in rats after the oral administration of 10 mg/kg RA with or without verapamil (Ver) pre-treatment (25 and 50 mg/kg). Each point represents the mean ± SD of six determinations.
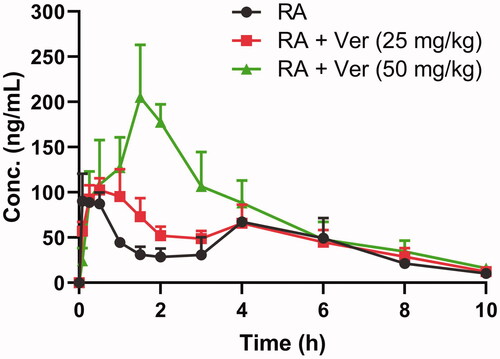
Table 1. The comparison of main pharmacokinetic parameters of rotundic acid in rats after a single oral administration at dose of 10 mg/kg with or without pre-treatment of verapamil at 25 and 50 mg/kg (mean ± SD, n = 6).
Table 2. Permeability (Papp), efflux ratio (RE), and net efflux ratio (NRE) of Rhodamine 123 and RA with or without P-gp inhibitor verapamil (Ver) across MDCKII-Mock and MDCKII-MDR1 cell monolayers at the incubation time of 20 min (mean ± SD, n = 3).
Figure 2. Bidirectionally transported amounts (pmol/cm2) of RA across (a, c) MDCKII-Mock and (b, d) MDCKII-MDR1 monolayers from 10 to 60 min. (a, b), 25 μM RA. (c, d) 25 μM RA + 50 μM Ver. Each point represents the mean ± SD of three determinations. AP: apical side; BL: basolateral side.
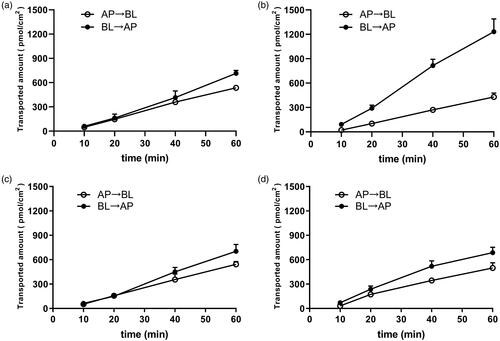
Figure 3. Effects of verapamil on the transported amount of RA across Caco-2 cell monolayer in different time points with a concentration of 25 μM. Each point represents the mean ± SD of three determinations. AP: apical side; BL: basolateral side.
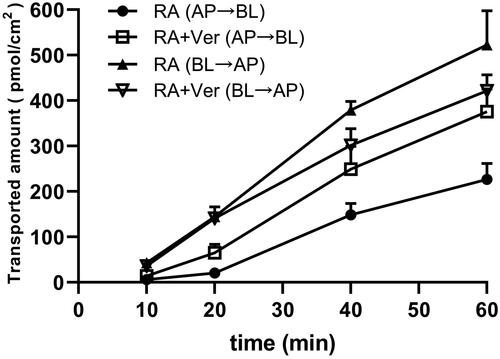
Table 3. Time course of rotundic acid transport across the Caco-2 cell monolayer with or without P-gp inhibitor verapamil (mean ± SD, n = 3).
Figure 4. Time dependent metabolic depletion of RA against five rhCYPs. Initial concentration of RA was 2 µM, and protein concentration of rhCYPs was 25 pM. Each point represents the mean ± SD of three determinations.
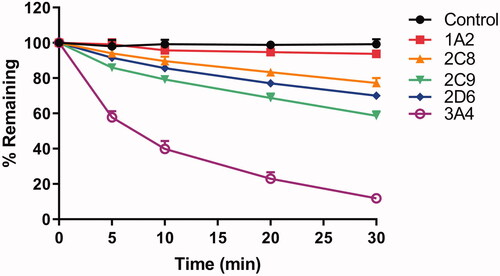
Figure 5. In vitro metabolic stability of rotundic acid (RA) in rat liver microsomes with or without treatment of verapamil (Ver). (a) Plots of relative remaining substrate level versus time. (b) The natural logarithm (ln) of relative remaining substrate level versus time. Each point represents the mean ± SD of three determinations.
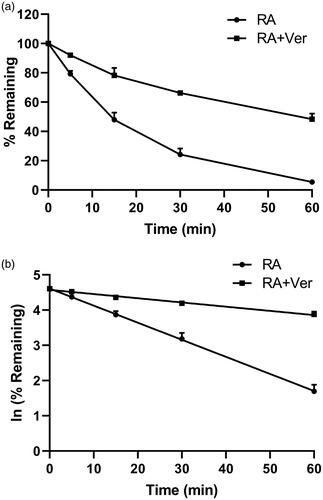
Table 4. The comparison of in vitro metabolic parameters of rotundic acid in rat liver microsomes with or without pre-treatment of verapamil (mean ± SD, n = 3).