Figures & data
Figure 1. Venn diagram of the components of RYNM.
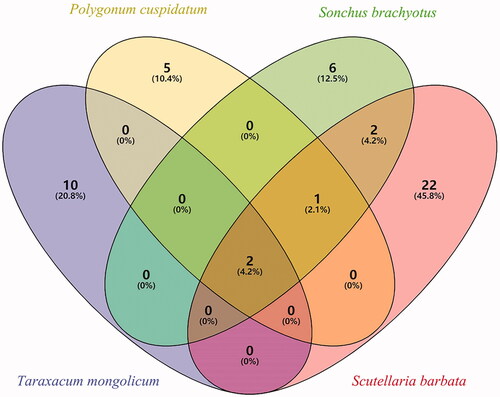
Table 1. Information of active ingredients in RYNM.
Figure 2. Network diagram of ‘medicinal materials-ingredients-targets’ of RYNM. The squares represent the medicinal materials in RYNM, the ovals represent the TCMSP chemical composition numbers, and the diamonds represent the targets.
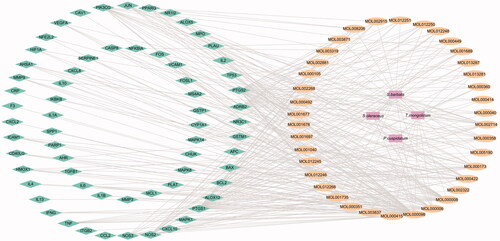
Figure 3. PPI network diagram of RYNM active targets.
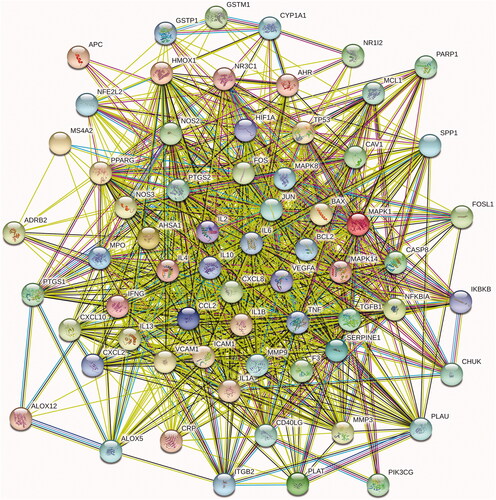
Figure 4. Bubble analysis of the active target KEGG metabolic pathway. The size of the dot represents the number of target proteins enriched in the pathway.
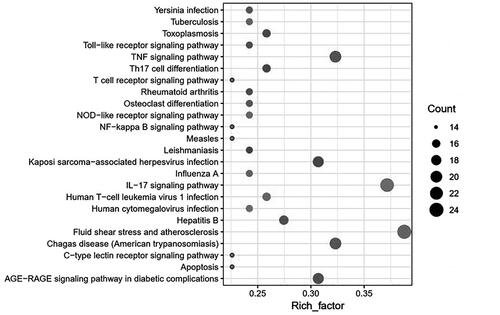
Figure 5. Bar graph for GO enrichment analysis of active targets.
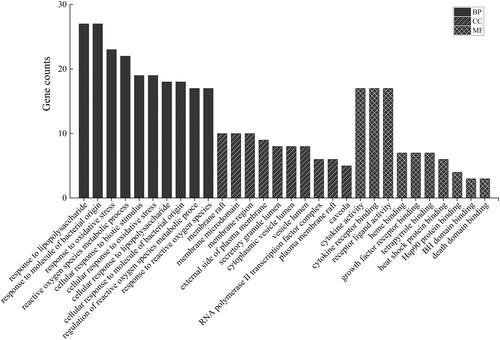
Figure 6. ‘Composition-target-path’ network diagram of RYNM. The ovals represent the chemical constituents in RYNM, the diamonds represent potential targets and the inverted triangles represent metabolic pathways.
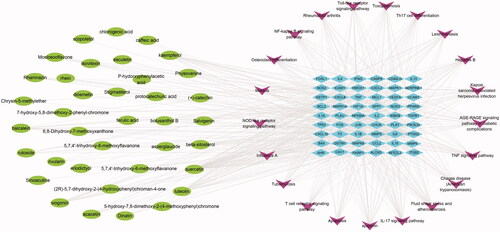
Figure 7. Pathological observation of HE staining in the lung tissue of each group of rats (×200). (A) Control group; (B) model group; (C) levofloxacin hydrochloride group; (D) RYNM group. Severity of lesions in each group: B » C > A>D; infiltration of inflammatory cells: B » C > A>D.
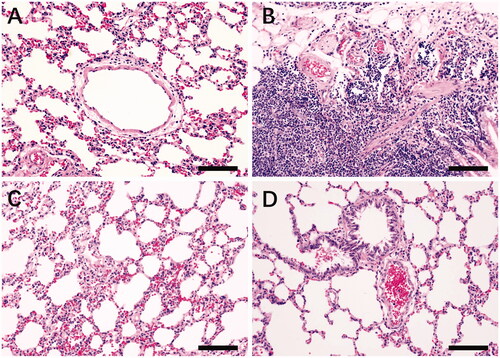
Figure 8. ELISA results of rat serum and alveolar lavage fluid. The black bars represent the expression levels of factors in serum, and the gray bars represent factor levels in alveolar lavage fluid. Data were expressed as the mean ± S.E.M. (n = 10). #p < 0.05 vs. control group. *p < 0.05, ***p < 0.001 vs. model group.
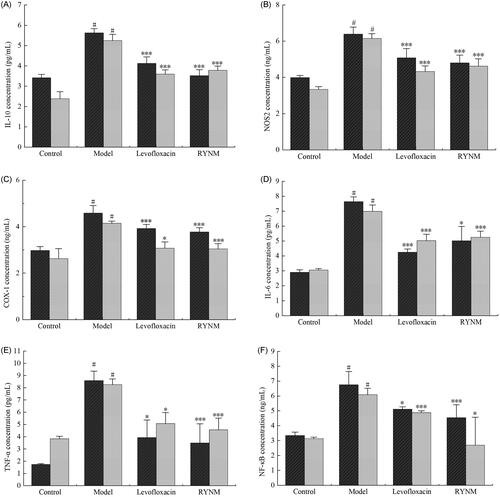
Table 2. Effect of RYNM on serum IL-10, NOS2, COX-1, IL-6, TNF-α and NF-κB levels in pneumonia model rats (mean ± S.D., n = 10).
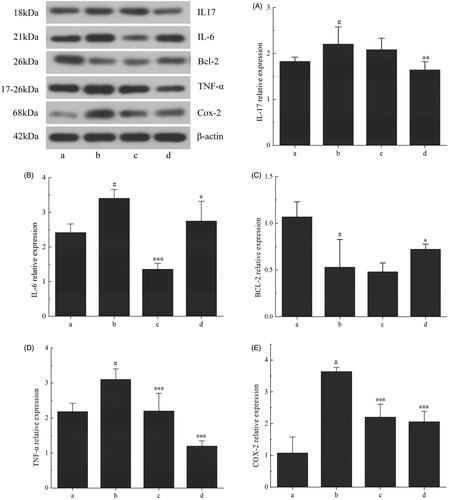
Figure 9. Western blot of rat lung tissue. (a) The control group, (b) the model group, (c) the levofloxacin group and (d) the RYNM group. Data were expressed as the mean ± S.E.M. (n = 10). #p < 0.05 vs. control group. *p < 0.05, **p < 0.01, ***p < 0.001 vs. model group.