Figures & data
Figure 1. Anti-arthritic activities of GSZD. (A) Overview of methods. (B) Representative images of the joints of CIA rats in different groups. (C) GSZD impact on the changes in paw volume (left) and arthritis score (right) in CIA rats.
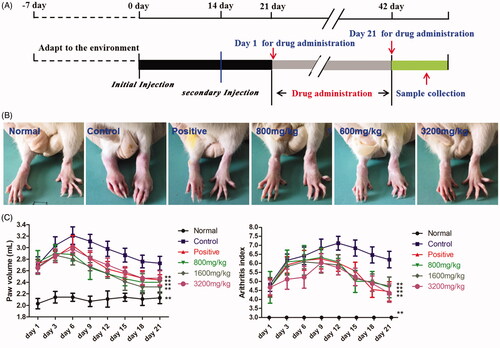
Figure 2. GSZD impact on ankle joint histopathology in CIA model rats visualized by the H&E staining.
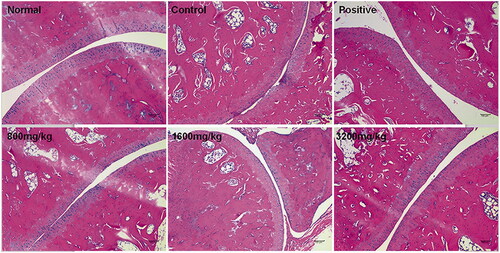
Figure 3. GSZD impact on ankle joint histopathology in CIA model rats visualized by the safranin O-fast green staining.
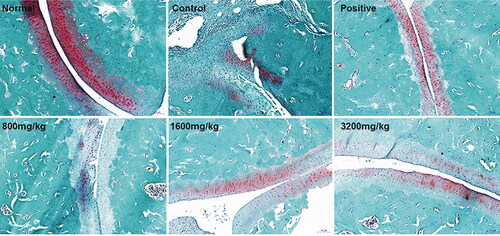
Figure 4. Results of the micro-CT imaging of ankle joints (A) and knee joints (B) of CIA rats. Data are the mean ± SD (n = 6), **p < 0.01 vs. control.
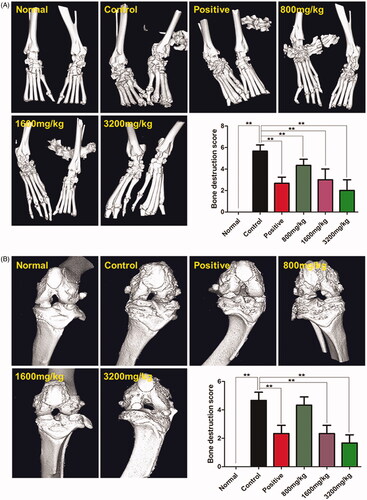
Figure 5. Effects of GSZD on the changes in osteoclasts of the ankle joint of CIA rats detected by TRAP staining (arrows indicate osteoclasts).
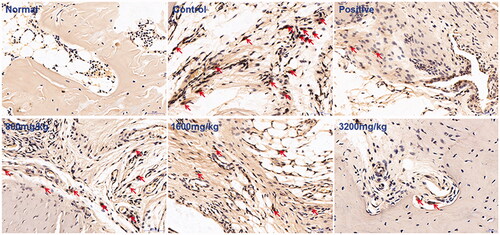
Figure 6. Effects of GSZD on serum levels of pro-inflammatory cytokines. Data are presented as the mean ± SD (n = 10), **p < 0.01 vs. control rats.
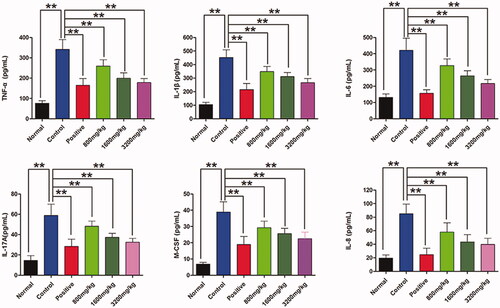
Figure 7. Effects of GSZD on the expression of RANKL (A) and OPG (B) in serum and synovial tissues. Data are the mean ± SD (n = 10), **p < 0.01 vs. control.
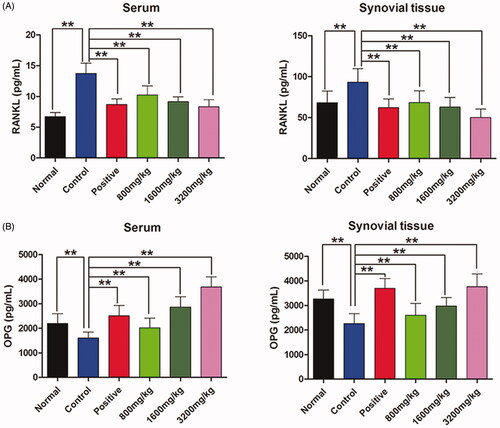
Figure 8. Cytotoxic effect of GSZD on RAW264.7 cells determined by the CCK-8 assay.
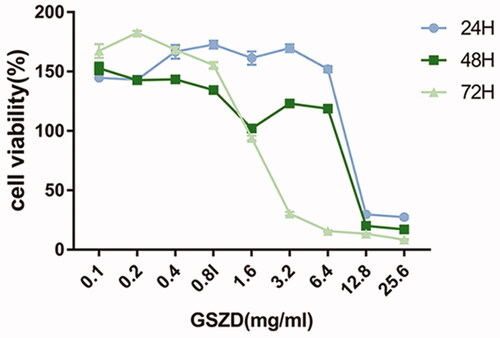
Figure 9. Effects of GSZD on TRAP staining (A) and bone resorption assay (B). Data are presented as the mean ± SD (n = 3), *p < 0.05, **p < 0.01 vs. control.
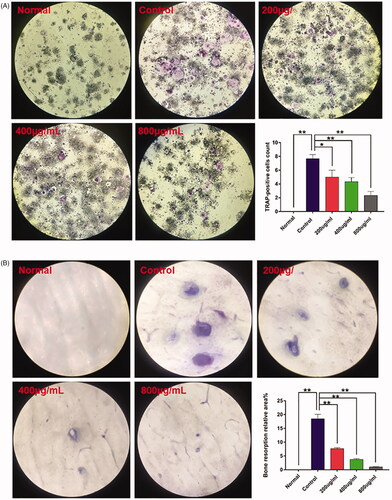
Figure 10. Effects of GSZD on the activation of the NF-κB signalling pathway in RANKL-induced OCs. Data are presented as mean ± SD (n = 3), **p < 0.01 vs. control.
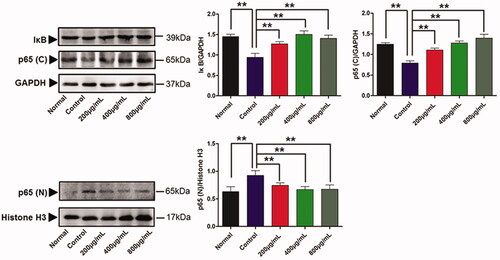
Figure 11. HPLC analysis of the composition of GSZD. Numbers 1–6 represent gallic acid, mangiferin, paeoniflorin, prim-O-glucosylcimifugin, cinnamic acid and glycyrrhizic acid, respectively.
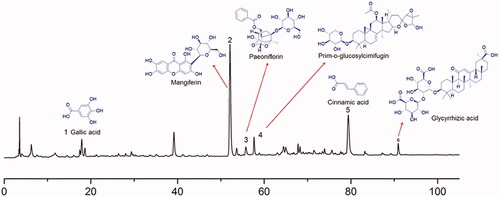
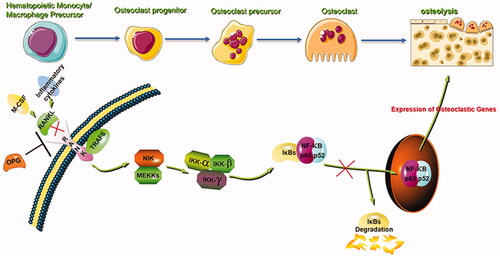
Figure 12. The mechanism of attenuation of RANKL-induced bone resorption by GSZD. GSZD suppresses the activation of NF-κB signalling during the differentiation of OCs.