
Figures & data
Figure 1. EUC’s molecular structure.
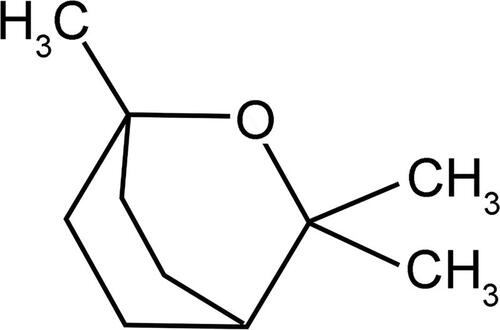
Figure 2. EUC ameliorated SAH-induced neurological deficits and brain edoema. EUC was dissolved into corn oil, and then the intraperitoneal injection (100 mg/kg) was performed 1 h before SAH and 30 min after SAH, respectively. (A) mNSS was adopted to evaluate neurological deficits of the rats at 24 and 48 h after SAH (n = 5); (B) Wet-dry method was employed to detect brain edoema in rats of each group (n = 3). *p < 0.05, **p < 0.01 and ***p < 0.001.
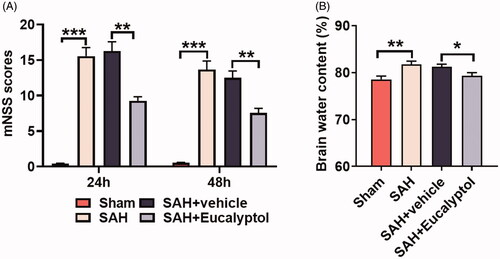
Figure 3. EUC’s effects on SAH-induced neuronal apoptosis. EUC was dissolved into corn oil, and then the intraperitoneal injection (100 mg/kg) was performed 1 h before SAH and 30 min after SAH, respectively. (A,B) Nissl staining was utilised to test neuronal apoptosis in the rats of each group (n = 3), Bar = 50 μm; (C,D) Western blot analysis was utilised to test the protein expressions of cleaved caspase-3 and Bcl-2 (n = 3). *p < 0.05, **p < 0.01 and ***p < 0.001.
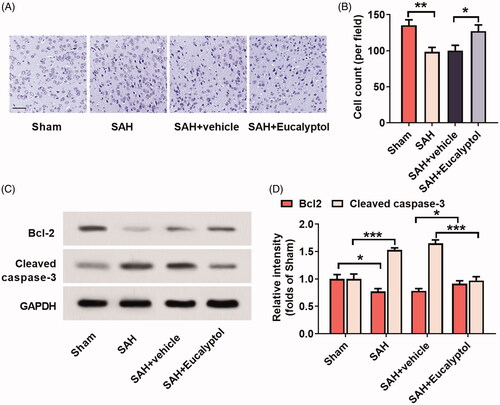
Figure 4. EUC’s effects on SAH-induced activation of microglial cells. EUC was dissolved into corn oil, and then the intraperitoneal injection (100 mg/kg) was performed 1 h before SAH and 30 min after SAH, respectively. (A,B) Western blot analysis was utilised to test the protein expression of Iba-1 and p-NF-κB p-65 in brain tissues of rats in each group (n = 3); (C–E) qRT-PCR was utilised to detect the relative expression of mRNAs of inflammatory cytokines TNF-α, IL-6 and IL-1β in brain tissues of the rats (n = 3). *p < 0.05, **p < 0.01 and ***p < 0.001.
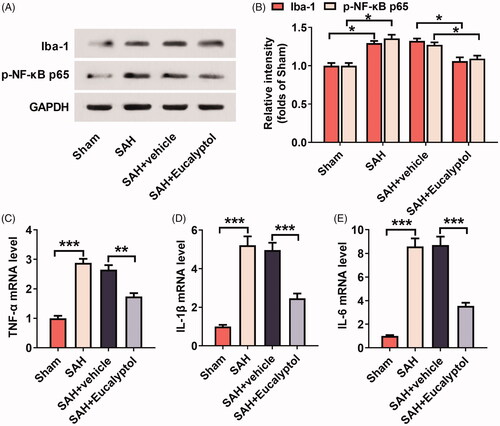
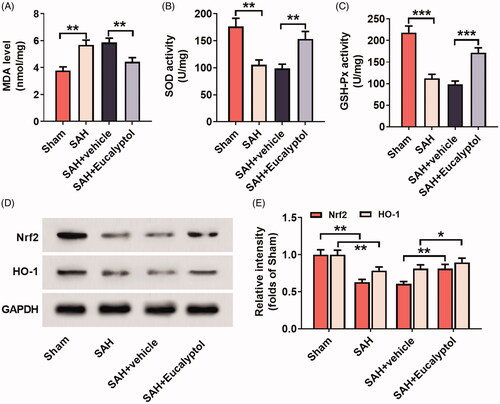
Figure 5. EUC’s effects on SAH-induced oxidative stress. EUC was dissolved into corn oil, and then the intraperitoneal injection (100 mg/kg) was performed 1 h before SAH and 30 min after SAH, respectively. (A–C) The MDA content, SOD and GSH-Px activity in brain tissues in rats of each group was determined (n = 3); (D–E) Western blot analysis was employed to detect the protein expression of HO-1 and Nrf2 in brain tissue of the rats of each group (n = 3). *p < 0.05, **p < 0.01 and ***p < 0.001.
Data availability statement
The data used to support the findings of this study are available from the corresponding author upon request.