
Figures & data
Figure 1. Cytotoxicity of alantolactone against CD4 T cells. (A) Chemical structure of alantolactone, (B) LDH and (C) CCK-8 assays were conducted to measure cytotoxicity after incubating CD4 T cells with various concentrations of alantolactone for 72 h. Data are representative of three independent experiments, and values are expressed as the mean ± SEM of samples of three wells. *p < 0.05, ***p < 0.001 compared with untreated controls, based on one-way ANOVA with Dunnett’s test.
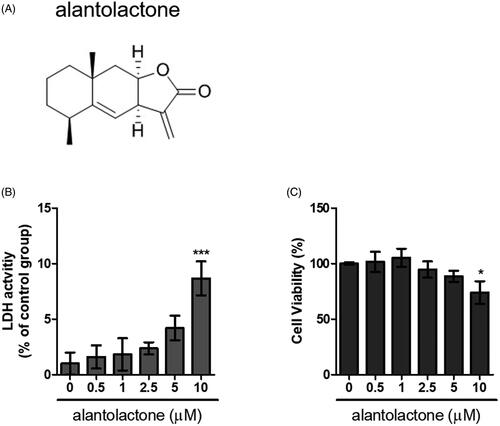
Table 1. Mouse gene PCR primer sequence.
Figure 2. Alantolactone inhibited Th17 differentiation in vitro. (A) IL-17 mRNA and (B) secreted IL-17A in culture medium were analysed by real-time RT-PCR and ELISA, respectively, at 72 h. The results of real-time PCR are presented as fold changes relative to the untreated control (set as 1.0). (C) The percentage of IL-17 cells among CD4 T cells was examined by flow cytometry. (D) Data are representative of three independent experiments, and values are expressed as the mean ± SEM of samples from three wells. **p < 0.01, ***p < 0.001 compared with CD4 T cells under Th17-polarizing conditions without alantolactone treatment, as determined by one-way ANOVA with Dunnett’s test.
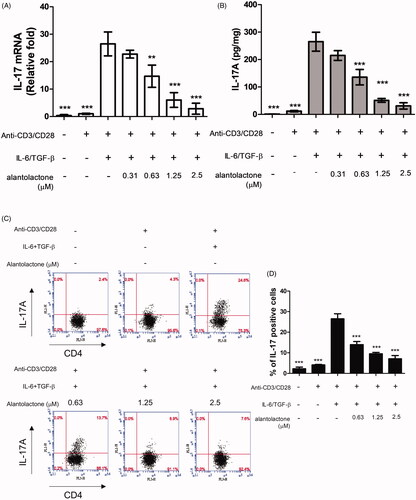
Figure 3. Alantolactone suppressed RORγt expression in CD4 T cells under Th17-polarizing conditions. (A) RORγt mRNA and protein expression was measured by real-time PCR and (B) Western blotting, respectively, at 72 h. Densiometric measurements of RORγt protein levels were normalized to the corresponding total protein level and expressed as relative values. Data are representative of three independent experiments, and values are expressed as the mean ± SEM of samples of three wells. *p < 0.05, ***p < 0.001 compared with CD4 T cells under Th17-polarizing conditions without alantolactone treatment, as determined by Student’s t-test.
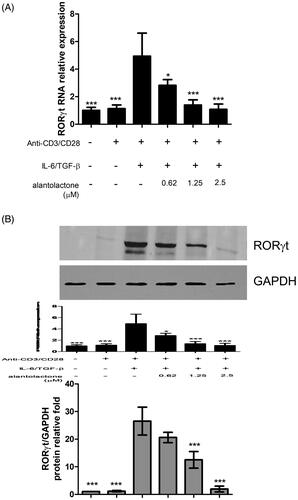
Figure 4. Alantolactone inhibited STAT3 phosphorylation in Th17-polarizing CD4 T cells at 24, 48 and 72 h. The expression levels of STAT3 and JAK2 with and without phosphorylation were determined by Western blotting. Data are expressed as relative results using ImageJ software compared with CD4 T cells under Th17-polarizing conditions without alantolactone treatments. Data are representative of three independent experiments, and values are expressed as the mean ± SEM of samples of three wells. **p < 0.01, ***p < 0.001 compared with CD4 T cells under Th17-polarizing conditions without alantolactone treatment, as determined by Student’s t-test.
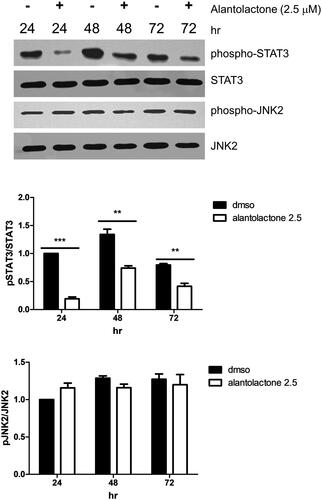
Figure 5. Alantolactone ameliorated the severity of CIA in mice. Beginning the day after the booster immunization, alantolactone (25 and 50 mg/kg) or vehicle (10% DMSO and 90% glyceryl trioctanoate) was administered orally once daily from day 21 to day 42. (A) Arthritis scores were monitored every three days after the immunization booster. Data are representative of three independent experiments, and values are expressed as the mean ± SEM (n = 6 per group). ***p < 0.001 versus vehicle-treated CIA control mice calculated with two-way ANOVA. (B) Histopathology of arthritic joints of alantolactone-treated and vehicle-treated mice by H&E staining of representative sections and (C) by histology scores at day 42 postimmunization (original magnification ×100). *p < 0.05, **p < 0.01, ***p < 0.001, versus the CIA vehicle group, as determined by one-way ANOVA with Dunnett’s test.
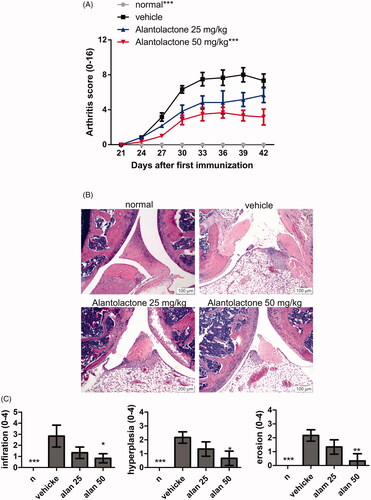
Figure 6. Evaluation of cytokine production in CIA mouse homogenized paw tissues under crotonoside treatments. The expression levels of the proinflammatory cytokines IL-6, TNF-α and IL-17A and the anti-inflammatory cytokine IL-10 were determined by ELISA for each tissue sample. Data (n = 6 per group) are representative of three experiments. Bar graphs are representative of three independent experiments. Values are expressed as the mean ± SEM (n = 6 per group). *p < 0.05, **p < 0.01, ***p < 0.001, versus the CIA vehicle group, as determined by one-way ANOVA with Dunnett’s test.
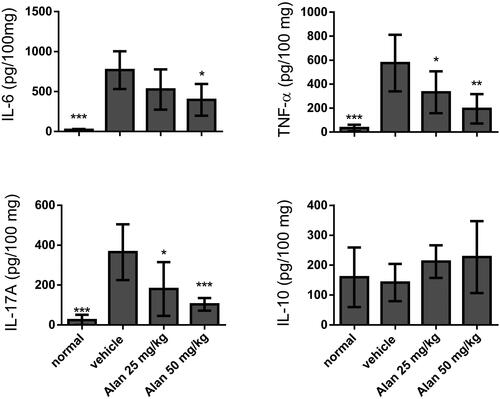
Figure 7. Alantolactone suppressed type II collagen (CII)-specific immune responses in mice with CIA. (A) Forty-two days postimmunization, serum was obtained from alantolactone- or vehicle-treated mice, and anti-CII IgG was measured by ELISA at a 1:2500 dilution. (B) Spleens were harvested at day 42 postimmunization and tested for their ability to proliferate in vitro for 72 h in medium containing CII (50 μg/mL). The proliferation of the spleen was measured by 3H-TdR incorporation, and the stimulation index was calculated. Bar graphs representative of three independent experiments. Values are expressed as the mean ± SEM (n = 6 per group). **p < 0.01, ***p < 0.001, versus the CIA vehicle group, as determined by one-way ANOVA with Dunnett’s test.
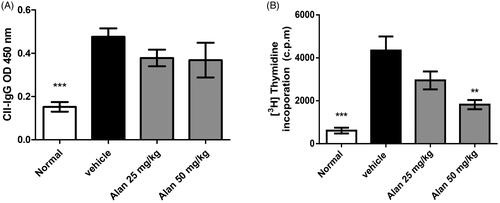
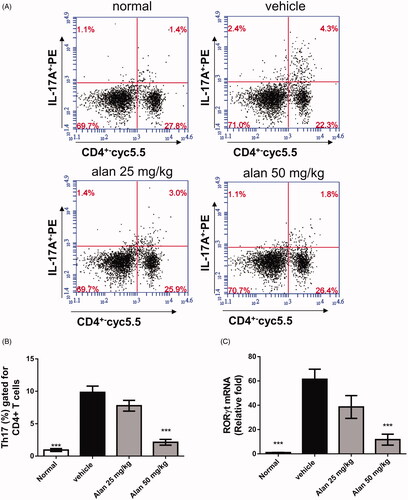
Figure 8. Alantolactone suppressed the Th17 immune response in mice with CIA. Splenocytes were obtained on day 42, cultured with CII (50 μg/mL) for 72 h, (A) stained with anti-CD4-Prep and anti-IL-17 17A-FITC antibodies, and analysed by flow cytometry. (B) Bar plots of the mean ± SEM from one of three independent experiments each with three or four mice/group. (C) The expression of ROR-γT mRNA in mouse spleen. Splenocytes were harvested on day 42, and relative expression levels of mRNA were measured by quantitative real-time RT-PCR using the ΔΔCT method with GAPDH mRNA as an internal control. Bar graphs representative of three independent experiments. Values are expressed as the mean ± SEM (n = 6 per group). ***p < 0.001, versus the CIA vehicle group, as determined by one-way ANOVA with Dunnett’s test.
Data availability statement
The data that support the findings of this study are available from either of the corresponding authors, Chi Chien Lin or Kuo Tung Tan, upon reasonable request.