Figures & data
Figure 1. Effect of NXT on wound closure in db/db mice. (A) Representative photographs of wounds on day 0, 4, 8, 12 and 16. Scale bar = 1 mm. (B) The percentage of wound closure area at day 0–16 post-injury. Results were presented as mean ± SD. **p < 0.01 and ***p < 0.001 vs. db/+ mice treated with saline, #p < 0.05, ##p < 0.01 and ###p < 0.001 vs. db/db mice treated with saline. n = 6.
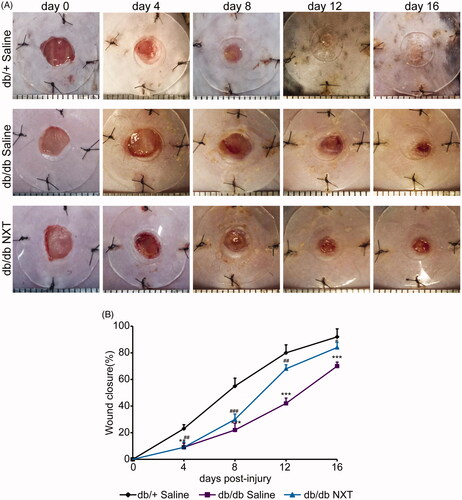
Figure 2. Effect of NXT on collagen deposition and ECM remoulding in diabetic wounds. (A) Masson’s trichrome staining wounds treated with NXT at day 7 and 16 post-injury. NXT increased collagen fibres in the wounds compared with saline. Collagen fibres were stained in blue. Scale bar = 500 μm. (B) Western blot of Col-3 and quantitative analysis of Col-3 at day 7 post-injury. (C) Immunofluorescence for CK14 at day 7 post-injury. Scale bar = 100 μm. (D) Immunofluorescence for vimentin at day 7 post-injury. Scale bar = 50 μm, and counterstained with DAPI. Results were presented as mean ± SD. *p < 0.05 vs. db/+ mice treated with saline, #p < 0.05 vs. db/db mice treated with saline. n = 3.
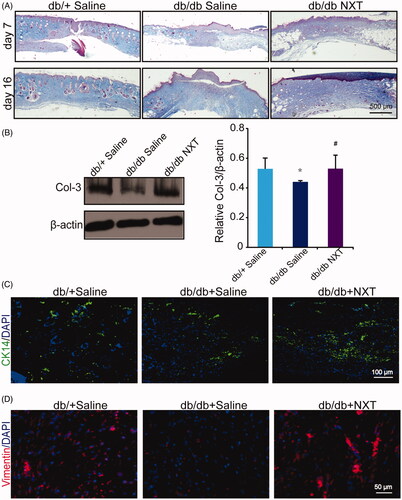
Figure 3. NXT decreased inflammatory response in diabetic wounds. (A) MPO protein expression at day 3 post-injury. (B, C) Relative gene expression of CXCL1 and CXCL2 at day 3 post-injury. (D) Immunofluorescence for Ly6G and CD68 at day 7 post-injury Scale bar = 100 μm. Results were presented as mean ± SD. *p < 0.05 and **p < 0.01 vs. db/+ mice treated with saline, #p < 0.05 and ##p < 0.01 vs. db/db mice treated with saline. n = 3.
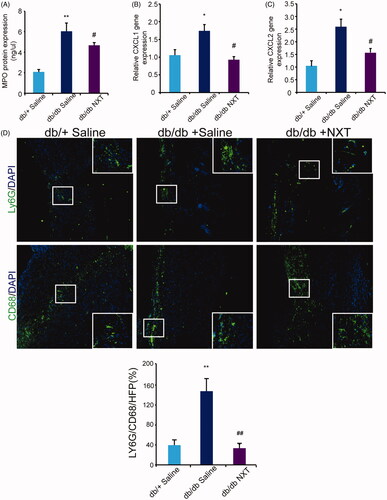
Figure 4. Effect of NXT on macrophage polarization in db/db mice. (A, B) Western blot of CD206 and CCR7 and quantitative analysis of CD206 and CCR7 in the wounds at day 3 and 7 post-injury. (C, D) Immunofluorescence for CCR7 and CD206 at day 7 post-injury. Scale bar = 100 μm. Results were presented as mean ± SD versus saline treated group, *p < 0.05 vs. db/+ mice treated with saline, #p < 0.05 vs. db/db mice treated with saline. n = 3.
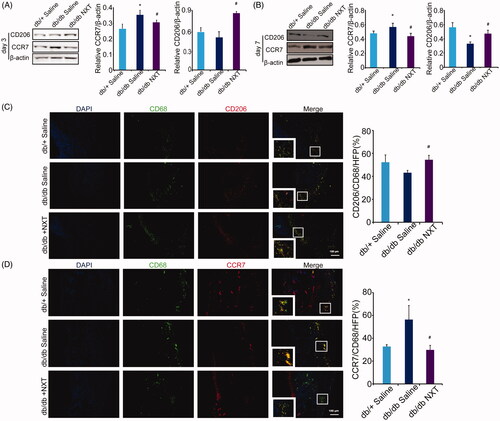
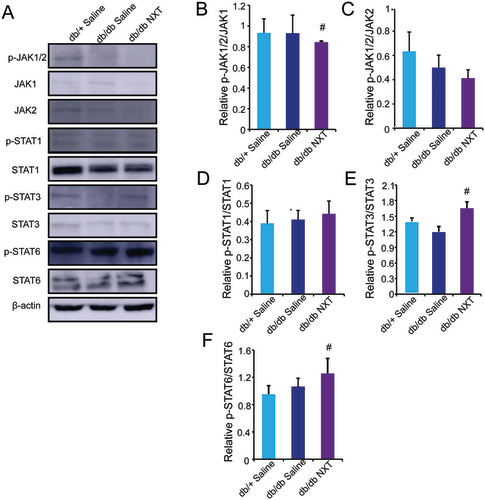
Figure 5. NXT regulated the JAK/STAT signalling pathway. (A–D) Western blot of p-JAK1/2, JAK1, JAK2, p-STAT1, STAT1, p-STAT3, STAT3, p-STAT6 and STAT6 and quantitative analysis of p-JAK1/2/JAK1, p-JAK1/2/JAK2, p-STAT1/STAT1, p-STAT3/STAT3 and p-STAT6/STAT6 in the wounds at day 3 post-injury. Results were presented as mean ± SD. #p < 0.05 vs. db/db mice treated with saline, n = 3.