Figures & data
Figure 1. Effects of Vc and glycerol on the stability of EGCG incubated in the dark at different temperatures (n = 3). *p < 0.05, **p < 0.01, and ***p < 0.001 means compared with EGCG at the same time and temperature. #p < 0.05; ##p < 0.01; ###p < 0.001 represents compared with EGCG of 0 h at the same temperature.
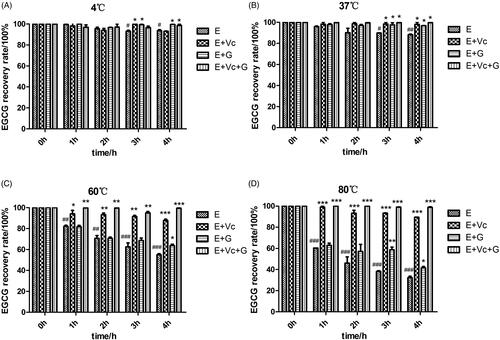
Figure 2. Effects of Vc and glycerol on the stability of EGCG incubated in the dark at 37 °C with different pH values (n = 3). *p < 0.05, **p < 0.01, and ***p < 0.001 means compared with EGCG at same time. #p < 0.05, ##p < 0.01, and ###p < 0.001 expresses compared with EGCG at 0 h.
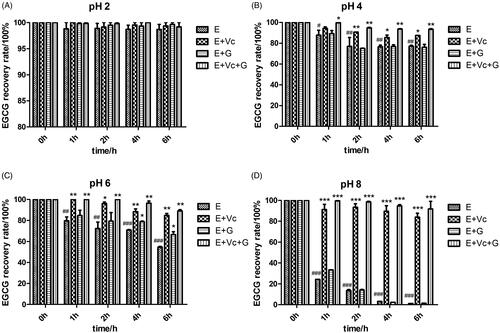
Figure 3. Effects of Vc and glycerol on the stability of EGCG in artificial simulated gastrointestinal fluids incubated at 37 °C in the dark (n = 3). *p < 0.05; **p < 0.01, and ***p < 0.001 means compared with EGCG at same time. #p < 0.05, ##p < 0.01, and ###p < 0.001 represents compared with EGCG at 0 h.
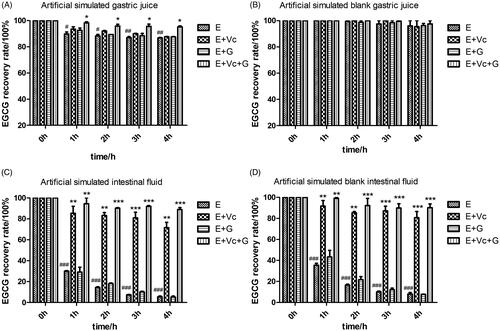
Figure 4. Effect of EGCG combined with Vc and glycerol on serum UA in the hyperuricemic mice. Values are means ± SE (n = 6). ***p < 0.001 when compared with the NC group; #p < 0.05, ##p < 0.01, ###p < 0.001 when compared with the MC group. Δp < 0.05 when compared with the E group.
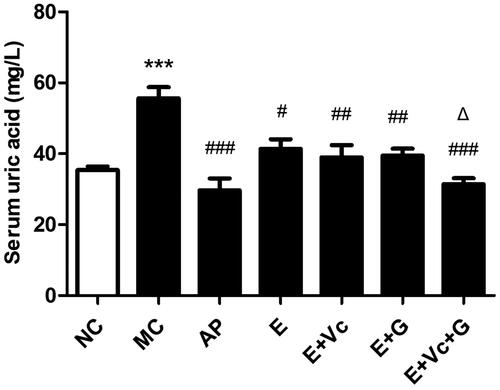
Figure 5. Effect of EGCG combined with Vc and glycerol on serum BUN (A) and Cr (B) levels in the hyperuricemic mice. Values are means ± SE (n = 6). **p < 0.01, ***p < 0.001 when compared with the NC group; #p < 0.05, ###p < 0.001 when compared with the MC group. ΔΔΔp < 0.001 when compared with the E group.
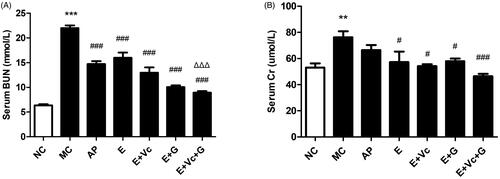
Figure 6. Effect of EGCG combined with Vc and glycerol on the activities of hepatic ADA (A) and XOD (B) in the hyperuricemic mice. Values are means ± SE (n = 6). **p < 0.01, ***p < 0.001 when compared with the NC group; ##p < 0.01, ###p < 0.001 when compared with the MC group. ΔΔp < 0.01 when compared with the E group.
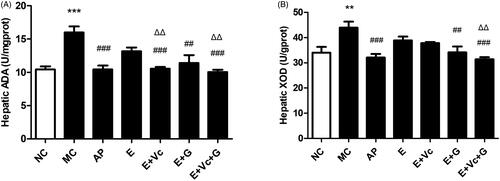
Figure 7. Effect of EGCG combined with Vc and glycerol on the mRNA expression of renal GLUT9, URAT1, ABCG2, and OAT1/2 in the hyperuricemic mice. Values are means ± SE (n = 6). *p < 0.05, **p < 0.01, ***p < 0.001 when compared with the NC group; #p < 0.05, ##p < 0.01, ###p < 0.001 when compared with the MC group. ΔΔΔp < 0.001 when compared with the E group.
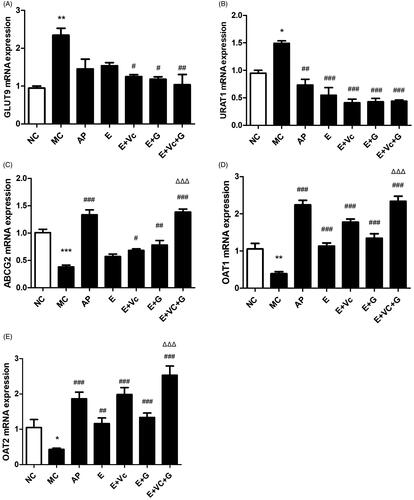
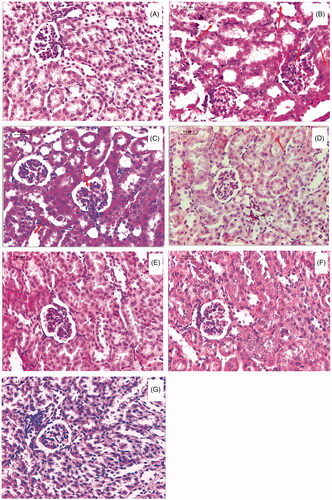
Figure 8. Morphological examination of the kidneys (HE, 400×). (A) NC control; (B) MC group; (C) AP group; (D) EGCG group; (E) EGCG + Vc group; (F) EGCG + glycerol group; (G) EGCG + Vc + glycerol group.