Figures & data
Table 1. The primer sequences for RT-PCR.
Table 2. Erectile times of rats in each group after drug intervention.
Figure 1. (a) The body weight in rats from the Z, M, T, DD, DG groups. (b) The blood glucose in rats from the Z, M, T, DD, DG groups. (c) The insulin in rats from the Z, M, T, DD, DG groups. (d) The glucagon in rats from the Z, M, T, DD, DG groups. (e) The blood eNOS in rats from the Z, M, T, DD, DG groups. (f) The blood FSH in rats from the Z, M, T, DD, DG groups. (g) The blood T in rats from the Z, M, T, DD, DG groups. (h) The cGMP protein in rats from the Z, M, T, DD, DG groups. Data are expressed as the mean ± SEM. Multiple comparisons analysis were conducted using ANOVA followed by t-testing.Differences with p < 0.05 were considered statistcally significant. #p < 0.05, the M group versus the Z group; *p < 0.05, the T, DD, DG groups vs the M group.
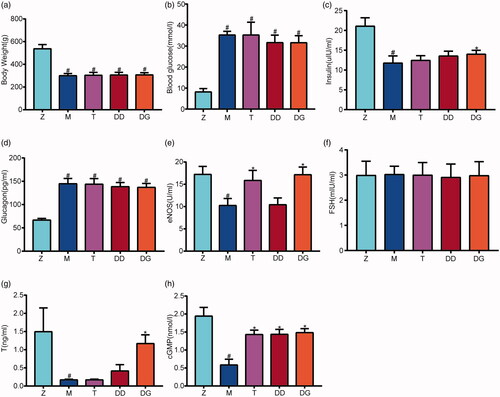
Figure 2. (a) HE staining of testicular tissues of rats from the Z, M, T, DD, DG groups (×200). In Group Z: (i) There were some red blood cells in the sinus space, and the inner wall of the blood sinus was covered with flat endothelial cells. There was no proliferation of interstitial tissue (Arrow ①). In Group M: (i) The number of blood sinuses decreased significantly, the number of small blood vessels decreased, and the distribution of blood sinuses was disordered (Arrow ②); (ii)The density of endothelial cells and smooth muscle cells decreased significantly, and the number of collagen fibres increased (Arrow ③). In Group T: (i) The distribution of blood sinuses was relatively uniform, and red blood cells could be seen locally in the blood sinus space (Arrow ④). In Group DD: (i) The distribution of blood sinus was more regular than that of group M (Arrow ⑤). In Group DG: (i) The density of endothelial cells increased and the number of collagen fibres decreased (Arrow ⑥). (b) Ultrastructure of penile tissue of rats from the Z, M, T, DD, DG groups (×5000). In Group Z: (i) Smooth muscle cells had normal morphology and structure, regular nucleus, abundant mitochondria, normal structure, clear inner ridge and tight arrangement of myofilaments (Arrow ①). In Group M: (i) some smooth muscle cells were swollen, the inner ridges of mitochondria in muscle cells were clear, and the myofilaments in some swelling cells were closely arranged and slightly loose (Arrow ②); In Group T, DD, DG: (i) Smooth muscle cells had normal morphological structure, regular nucleus, clear inner ridge of mitochondria and tight arrangement of myofilaments.(Arrow ③④⑤⑥).
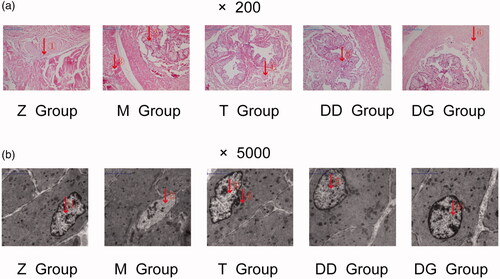
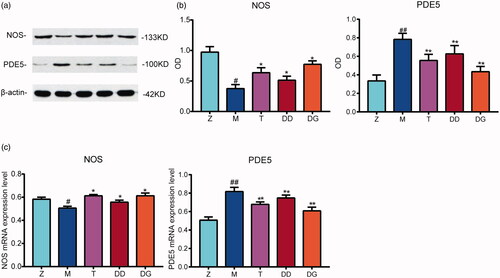
Figure 3. (a) The expression levels of two proteins (NOS, PDE5) in rats from the Z, M, T, DD, DG groups groups determined using western blotting. (b) Electrophoreto gram of two proteins (NOS, PDE5) in rats from the Z, M, T, DD, DG groups. (c) The mRNA expression levels of two proteins (NOS, PDE5) in rats from the Z, M, T, DD, DG groups determined using RT-qPCR. NOS, PDE5 Data are expressed as the mean ± SEM. Multiple comparisons analysis were conducted using ANOVA followed by t-testing. Differences with P < 0.05 were considered statistically significant. #p < 0.05 and ##p < 0.01, the M group versus the Z group; *p < 0.05 and **p < 0.01, the DD, DG groups vs the M group.