Figures & data
Figure 1. Protective effects of ICA against aging associated neuron damage in the cortex and hippocampus CA1 and CA3 regions of rats. After HE staining, the morphological changes of rat cortex and hippocampus was observed under an optical microscope (400×). In the cortex and CA3 region, the neurons of 6 M are normal in shape, and degeneration is rare; the neurons of 20 M have no obvious changes in density, but the degeneration neurons increased significantly. In the CA1 region, neurons are arranged tightly in adult rat, the number of cell layers is 2–3. However, the neuronal number of aging rats is reduced and the number of cell layers decreased to 1–2 layers. The arrows indicated damaged neurons.
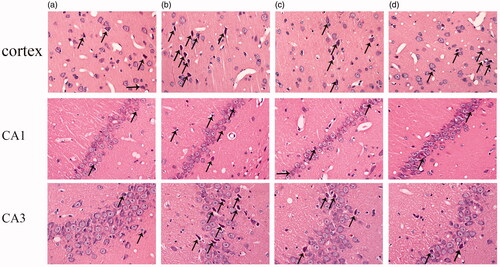
Figure 2. ICA effectively improves the condition of neurons (400×). Nissl body is mainly distributed in the cytoplasm of neurons except axons, and its main function is to synthesize protein. Compared with 6 M, the staining of Nissl bodies in cortex and hippocampus of 20 M rat became lighter, which suggesting the neuronal function is impaired. ICA significantly reversed the trend in a dose-dependent manner.
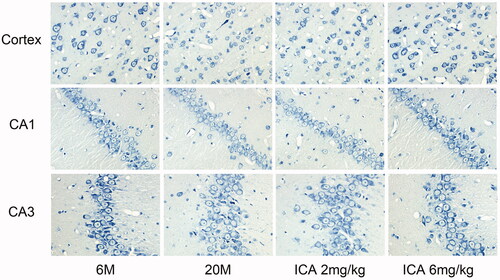
Figure 3. ICA enhances autophagy in the cortex (a) and hippocampus (b) of aging rat. The level of autophagy was significantly reduced in aging rat brain, and ICA intervention can increase autophagy in the cortex and hippocampus. (n = 4, *p < 0.05 vs. 6 M; **p < 0.01 vs. 6 M; #p < 0.05 vs. 20 M; ##p < 0.01 vs. 20 M).
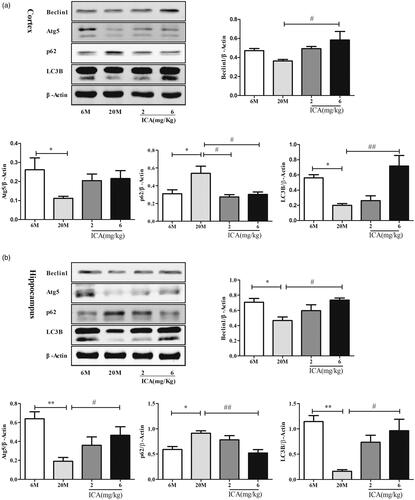
Figure 4. ICA enhances autophagy levels via inducing AMPK-mTOR-ULK1 pathway in cortex (a) and in the hippocampal (b) of aging rats. ICA promotes the phosphorylation of AMPK in the cortex and hippocampus of aging rats, resulting inhibits mTOR phosphorylate and reduces the phosphorylation of ULK1 serine 757. (n = 4, *p < 0.05 vs. 6 M; **p < 0.01 vs. 6 M; #p < 0.05 vs. 20 M; ##p < 0.01 vs. 20 M).
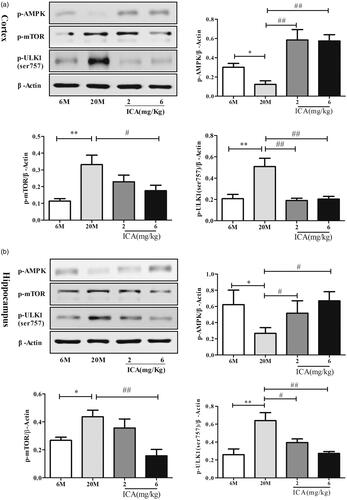
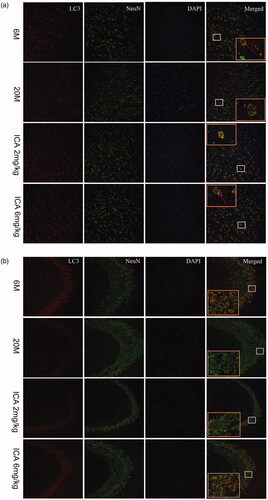
Figure 5. Double-immunofluorescence staining of LC3 and NeuN in cortex (a) and hippocampal CA3 region (b). The expression of LC3 shows in the first column from left; the Neun-labeled neurons shows in the second column; DAPI stains the nucleus and shows in the third column. Compared with 6 M group, the fluorescence intensity of LC3 is significantly reduced in 20 M. After the intervention of ICA, the fluorescence intensity of LC3 increased remarkably. The enlarged image (right) shows the characteristic co-localization image (200×).