Figures & data
Figure 1. The HPLC chromatograms of standards and DHHP extracts. (A) Mix standards. (B) DHHP extracts. 1: Danshensu. 2: Hydroxysafflor-yellow-A. 3: Rosmarinic acid. 4: Lithospermic acid. 5: Salvianolic acid B.
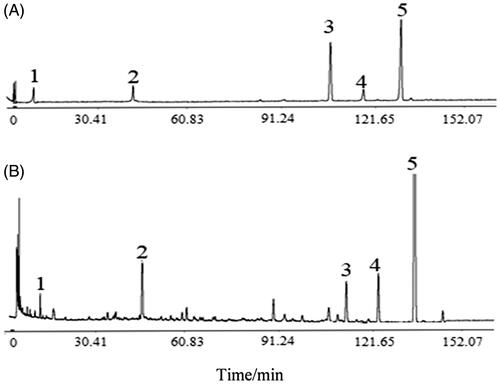
Figure 2. Myocardial pathology and myocardial infarct size in every groups. (A) Photos of myocardium with TTC staining. (B) Myocardial infarct size (%). (C) Representative photos of myocardium stained with HE (200×). Data were expressed as the mean ± SD (n = 6). **p < 0.01 vs. Con; *p < 0.05 vs. Con; ##p < 0.01 vs. IR #p < 0.05 vs. IR.
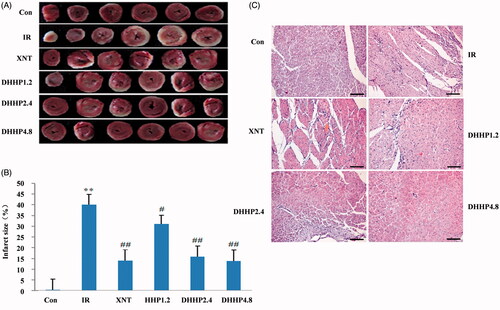
Figure 3. Effects of DHHP on Cell toxicity and Cell viability of H9C2. (A) The cell toxicity. (B) The cell viability. Data were expressed as the mean ± SD (n = 10). **p < 0.01 vs. Con; *p < 0.05 vs. Con; ##p < 0.01 vs. IR; #p < 0.05 vs. IR.
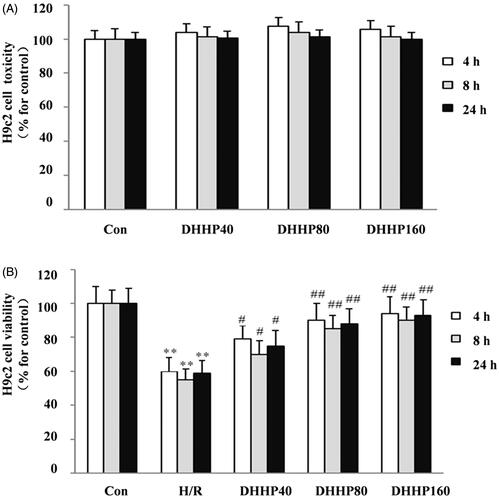
Figure 4. Myocardial pathology and infarct size. (A) Photos of myocardium after TTC staining. (B) Infarct size as a percentage of total size. (C) Photos of myocardium stained with HE (200×). Data were expressed as the mean ± SD (n = 6). ΔΔp < 0.01 vs. Con, **p < 0.01 vs. IR, #p < 0.05 vs. DHHP2.4.
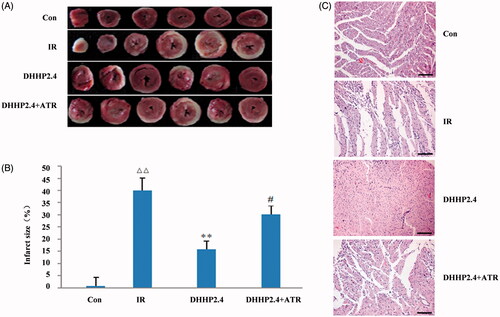
Figure 5. The Cardiomyocyte apoptosis (400×). (A) TUNEL detected slices. (B) Quantification of TUNEL detection. Data were expressed as the mean ± SD (n = 6). ΔΔp < 0.01 vs. Con, **p < 0.01 vs. IR, #p < 0.05 vs. DHHP2.4.
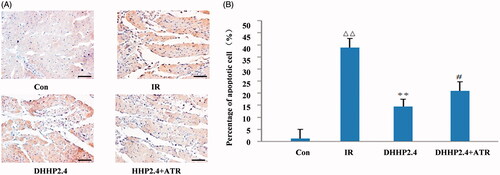
Figure 6. ATR reverses effects of DHHP on the cytochrome c, cleaved caspase-9 and cleaved caspase-3 protein levels. (A) Western blot analysis of Cytochrome C, cleaved caspase-9 and cleaved caspase-3 protein expression. (B) The relative expression levels of Cytochrome C in each group. (C) The relative expression levels of cleaved Caspase-9 in each group. (D) The relative expression levels of cleaved Caspase-3 in each group. Data were expressed as the mean ± SD (n = 3), ΔΔp < 0.01 vs. Con, **p < 0.01 vs. IR, #p < 0.05 vs. DHHP2.4, ##p < 0.01 vs. DHHP2.4.
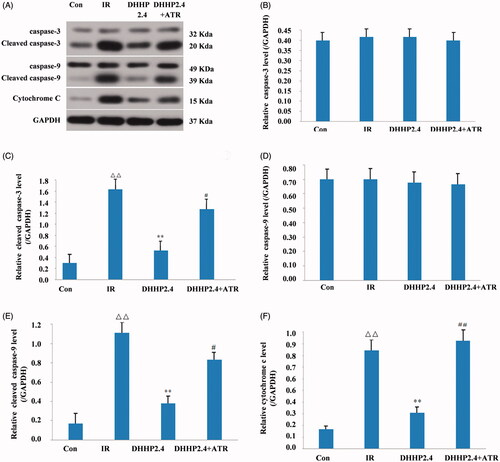
Figure 7. Effects of DHHP on the Bcl-2 and Bax protein. (A) Western blot analysis of Bcl-2 and Bax protein expression. (B) The relative expression levels of Bcl-2 in each group. (C) The relative expression levels of Bax in each group. (D) The ratio of Bax and Bcl-2 in each group. Data were expressed as the mean ± SD (n = 3), Δ<0.05 vs. Con, ΔΔp < 0.01 vs. Con, *p < 0.05 vs. IR, **p < 0.01 vs. IR, #p < 0.05 vs. DHHP2.4, ##p < 0.01 vs. DHHP2.4.
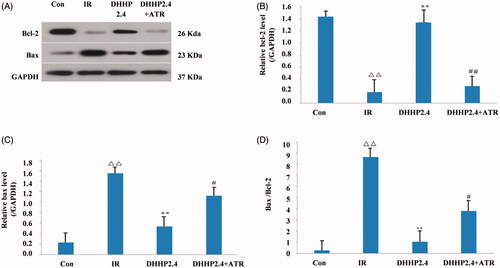
Figure 8. The influence of DHHP on MPTP opening. (A) The representative electron images of myocardial mitochondria (5000×). (B) The content of NAD+ in ischaemic myocardium. (C) The sensitivity of MPTP to calcium. (D) The membrane potential of isolated mitochondria. Data were expressed as the mean ± SD (n = 6), Δp < 0.05 vs. Con, *p < 0.05 vs. IR, #p < 0.05 vs. DHHP2.4.
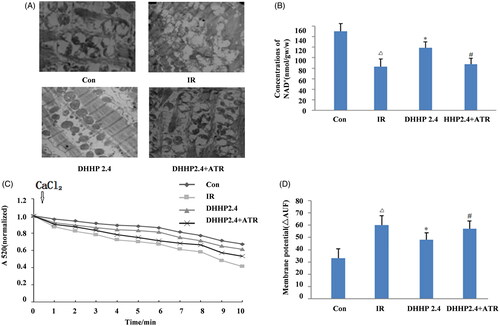
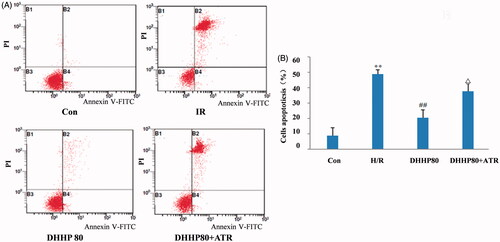
Figure 9. Effects of DHHP on cell apoptosis. (A) Two-dimensional scatter plot of apoptosis. (B) Quantification of apoptosis. Data were expressed as the mean ± SD (n = 10). **p < 0.01 vs. Con; ##p < 0.01 vs. H/R; Δp < 0.05 vs. DHHP 80.