
Figures & data
Table 1. Primers designed for qRT-PCR validation of candidate miRNAs, mRNAs, and circRNAs.
Figure 1. Effects of PSP on spatial learning and memory deficiency in mice experiencing brain ageing. (A) Representative images of swimming paths undertaken on the fifth day of the spatial acquisition test, and (B) the time needed to reach the hidden platform. (C) Spatial memory function was tested by counting the number of times each mouse crossed the target platform within 90 s. (D) Representative images of swimming paths in the spatial probe trial. Data are expressed as the mean ± SD (n = 6 per group; escape latency was analysed by repeated measures analysis of variance (ANOVA); other data were analysed by one-way ANOVA followed by least significant difference tests). *p < 0.05, vs. Control group; #p < 0.05 vs. Model group.
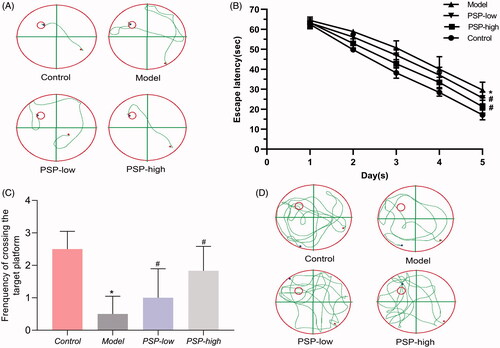
Figure 2. Distinct expression patterns of mRNAs and functional enrichment analyses. Heatmap of the expression profiles of significantly differentially expressed (DE) mRNAs between the Control group and Model group (A), and between the Model group and the PSP group (B). Volcano plot of the expression profiles of DE mRNAs between the Control group and Model group (C), and between the Model group and the PSP group (D). GO enrichment analysis of mRNAs that were altered by PSP treatment (E). The ordinate represents the GO term while the abscissa represents the − log10 (p-value). BP represents the biological process, CC represents the cellular component, and MF represents the molecular function. (F) KEGG enrichment analysis of mRNAs that were altered by PSP. The ordinate represents the KEGG pathway whilethe abscissa represents the − log10(p-value). PSP: Polygonatum sibiricum polysaccharide.
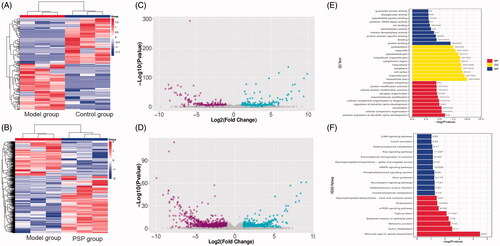
Table 2. Dysregulated mRNAs associated with the anti-brain ageing effect of PSP.
Figure 3. Distinct expression patterns of circRNAs and functional enrichment analyses Heatmap of the expression profiles of significantly differentially expressed (DE) circRNAs between the Control group and the Model group (A), and between the Model group and the PSP group (B). Volcano plot of the expression profiles of DE circRNAs between the Control group and the Model group (C), and between the Model group and the PSP group (D). GO enrichment analysis of circRNAs that were altered by PSP treatment (E). The ordinate represents the GO term while the abscissa represents the − log10 (p-value). BP represents the biological process, CC represents the cellular component, and MF represents the molecular function. (F) KEGG enrichment analysis of circRNAs altered by PSP. The ordinate represents the KEGG pathway, while the abscissa represents the − log10 (p-value). PSP: Polygonatum sibiricum polysaccharide.
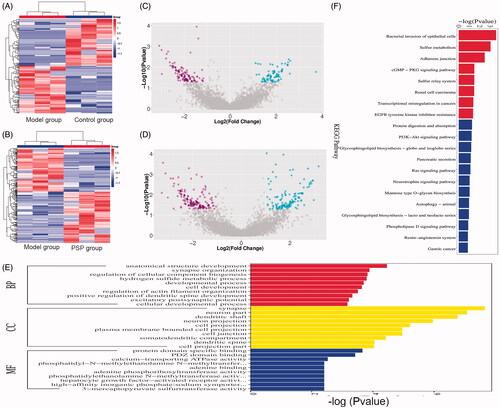
Table 3. Dysregulated circRNAs associated with the anti-brain ageing effect of PSP.
Figure 4. Distinct expression patterns of miRNAs and functional enrichment analyses Heatmap of significantly differentially expressed (DE) miRNAs between the Control group and the Model group (A), and between the Model group and the PSP group (B). Volcano plot of the expression profiles of DE miRNAs between the Control group and the Model group (C), and between the Model group and the PSP group (D). GO enrichment analysis of miRNAs altered by PSP treatment (E). The ordinate represents the GO term while the abscissa represents the − log10 (p-value). BP represents the biological process, CC represents the cellular component, and MF represents the molecular function. (F) KEGG enrichment analysis of miRNA altered by PSP: The ordinate represents the KEGG pathway while the abscissa represents the − log10(p value). PSP: Polygonatum sibiricum polysaccharide.
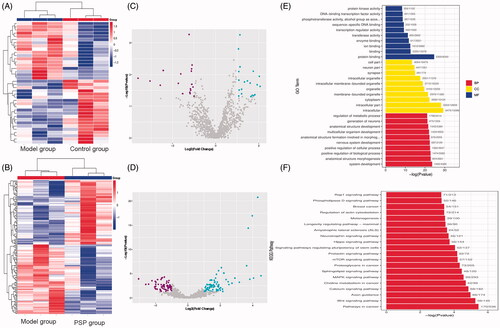
Table 4. Dysregulated miRNAs associated with the anti-brain ageing effect of PSP.
Figure 5. Differential expression of mRNAs, miRNAs, and circRNAs, as validated by real-time quantitative polymerase chain reaction (q-PCR). The miRNA expression levels detected by RNA sequencing (mmu-miR-182-5p, mmu-miR-183-5p, mmu-miR-5110, mmu-miR-7044-3p, mmu-miR-96-5p), mRNAs (Pianp, Ubl5, Stmn1, Tspyl2, Hnrnpu), and circRNAs (10:33996667|34012137, 7:84262393|84305259, 2:29227578|29248878, 11:29705535|29708770) were consistent with q-PCR results. ‘PSP’ represents brain ageing model mice treated with PSP. ‘Control’ represents untreated mice. ‘Model’ represents brain ageing model mice. PSP: Polygonatum sibiricum polysaccharide.
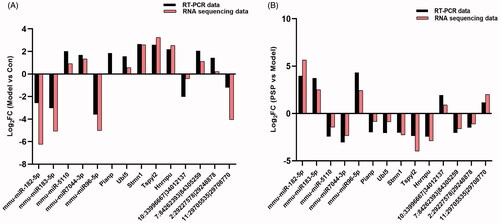
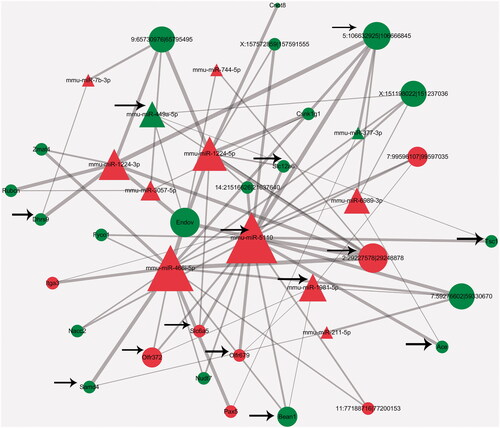
Figure 6. A circRNA-miRNA-mRNA interaction network. The circle, square, and triangle represent mRNA, circRNA, and miRNA, respectively. Red and green represent upregulation and downregulation, respectively. The arrow represents RNAs that underwent changes in response to PSP treatment. PSP: Polygonatum sibiricum polysaccharide.
Data availability statement
The data that support the findings of this study are available from the corresponding author upon reasonable request.