Figures & data
Table 1. Primer sequences and PCR conditions used in qRT-PCR.
Figure 1. Analysis of L. rotundiflorus seed extracts using 12% SDS-PAGE. Representative SDS-PAGE analysis of 5 experiments. Molecular weight marker (line 1), Cγ of L. rotundiflorus under native (line 2), and denaturing conditions (line 3).
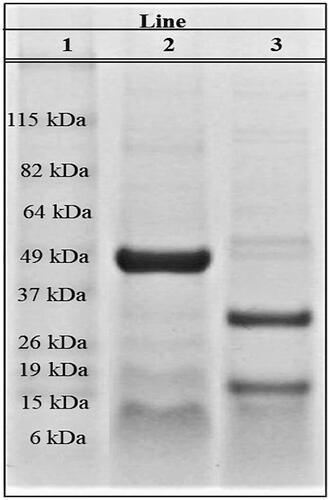
Table 2. Pre- and post-treatment levels of serum biochemical parameters.
Figure 2. Relative mRNA expression of Jnk1 in the liver of treated and untreated rats with experimental type 2 diabetes. Data are expressed as mean ± SEM of five rats per group. *p ˂ 0.05, **p ˂ 0.01 when compared with HG-Ctrl group; δp ˂ 0.05 when compared with Ctrl group. Ctrl, control group, nondiabetic rats without treatment; HG-Ctrl, diabetic rats administered with vehicle (saline); HG-Lr, diabetic rats treated with Cγ from L. rotundiflorus; HG-Met, diabetic rats treated with metformin.
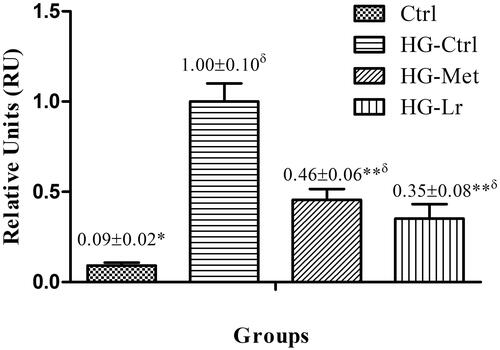
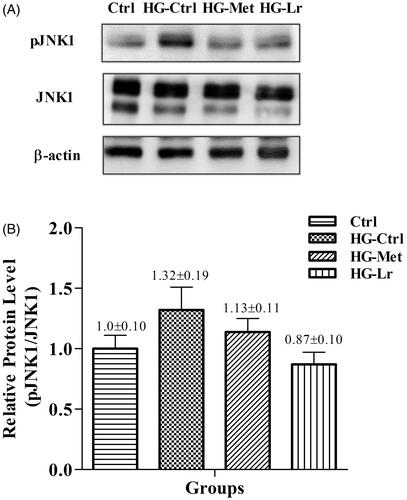
Figure 3. Western blot analysis of phosphorylated JNK1 in the liver of treated and untreated rats with experimental type 2 diabetes. (A) Representative blots are shown for each group. (B) Relative quantification of phosphorylated JNK1 expressed as phosphorylated JNK1/total JNK1 ratio, using β-actin as a loading control. Values represent mean ± SEM of five rats per group. Ctrl, control group, nondiabetic rats without treatment; HG-Ctrl, diabetic rats administered with vehicle (saline); HG-Lr, diabetic rats treated with Cγ from L. rotundiflorus; HG-Met, diabetic rats treated with metformin; pJNK1, phosphorylated JNK1.