
Figures & data
Table 1. Primers for quantitative real-time PCR.
Figure 1. Effect of PLP for six weeks on: body weight (A), liver tissue (B), epididymal fat (C), subcutaneous fat (D), diet intake (E), and energy intake (F). Data are shown as the mean ± SD (n = 8). ##p < 0.01, DC group vs. NC group; **p < 0.01, drug-treated group vs. DC group.
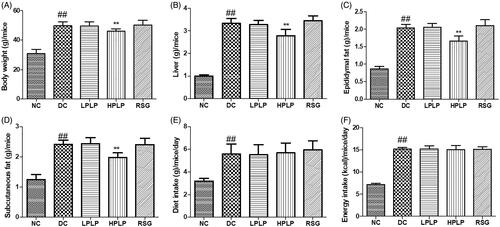
Figure 2. Effect of PLP treatment on the parameters of glucose tolerance and insulin resistance in db/db mice. Oral glucose tolerance test (OGTT) was carried out after six weeks of PLP treatment in all groups (A). Intraperitoneal insulin tolerance test (IPTT) was carried out after six weeks of PLP treatment in all groups. Data are shown as the mean ± SD (n = 8). ##p < 0.01, DC group vs. NC group; **p < 0.01, drug-treated group vs. DC group.
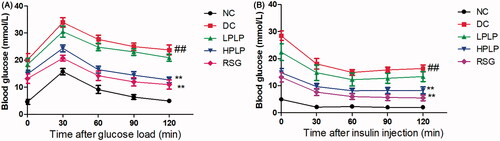
Figure 3. Effect of PLP on fasting blood glucose levels (A), insulin contents (B), and HOMA-IR (C) in db/db mice. Data are shown as the mean ± SD (n = 8). ##p < 0.01, DC group vs. NC group; **p < 0.01, drug-treated group vs. DC group.
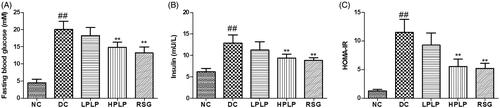
Figure 4. Effect of PLP on hepatic glucose metabolism in db/db mice. The hepatic PEPCK activity (A), hepatic G-6-Pase activity (B), hepatic GS activity (C), hepatic glycogen content (D), muscle glycogen content (E), epididymal fat glycogen content (F) and subcutaneous fat glycogen content (G). Data are shown as the mean ± SD (n = 8). ##p < 0.01, DC group vs. NC group; **p < 0.01, drug-treated group vs. DC group.
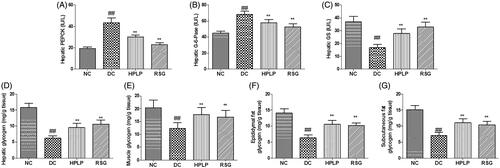
Figure 5. Effect of PLP on hepatic glucose metabolism-related gene expression levels in db/db mice. The relative mRNA levels of PEPCK (A), G6PC (B), FOXO1 (C), and GS (D) in the liver. Data are shown as the mean ± SD (n = 6). ##p < 0.01, DC group vs. NC group; **p < 0.01, drug-treated group vs. DC group.
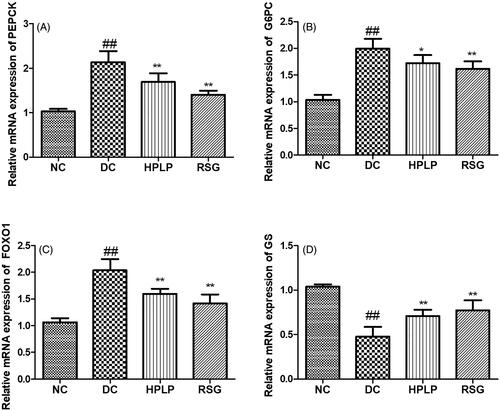
Figure 6. Effect of PLP on the Akt2/PI3K/GLUT2 insulin signalling pathway in db/db mice. The relative mRNA levels of Akt2 (A), PI3K (B), and GLUT2 (C) in the liver. The relative protein levels of p-Akt2 (D), p-PI3K (E), and GLUT2 (F) in the liver. Data are shown as the mean ± SD (n = 6). ##p < 0.01, DC group vs. NC group; **p < 0.01, drug-treated group vs. DC group.
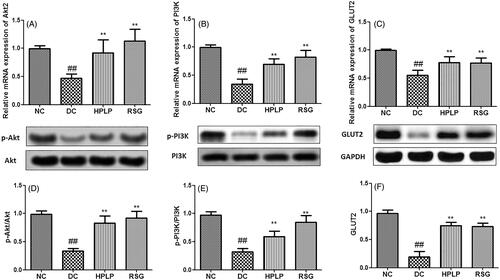
Figure 7. Effect of PLP on serum lipids profiles in db/db mice. The levels of TG (A), TC (B), LDL-C (C), HDL-C (D), and FFA (E) in the serum of mice. Data are shown as the mean ± SD (n = 6). ##p < 0.01, DC group vs. NC group; **p < 0.01, drug-treated group vs. DC group.
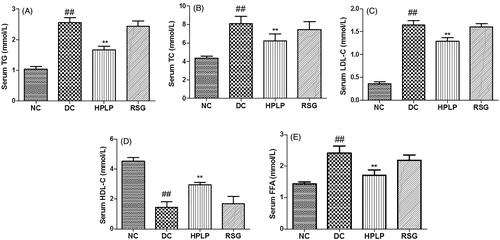
Figure 8. Effects PLP on hepatic lipid metabolism-related gene expression levels in db/db mice. The relative mRNA levels of PPARα (A), LDLR (B), SREBP-1 (C), and AAC (D) in the liver. Data are shown as the mean ± SD (n = 6). ##p < 0.01, DC group vs. NC group; **p < 0.01, drug-treated group vs. DC group.
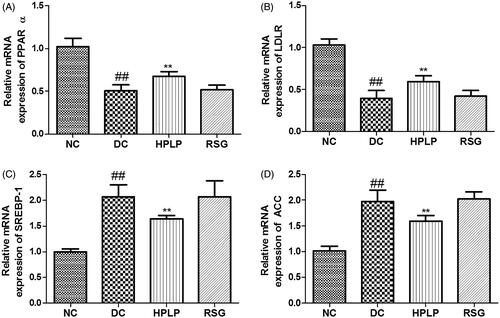
Table 2. Effects of PLP on serum biochemical results of mice during 14 consecutive days of subacute toxicity study.
Data availability statement
The datasets used and/or analysed during the current study are available from the corresponding author on reasonable request.