Figures & data
Table 1. Primer sequences used for reverse transcriptase polymerase chain reaction (RT-PCR).
Figure 1. Chromatogram of HemoHIM using HPLC alaysis. Peak number indicated: 1: chlorogenic acid, 2: paeoniflorin, 3: nodakenin.
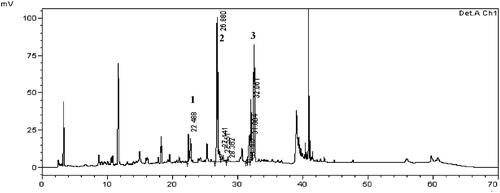
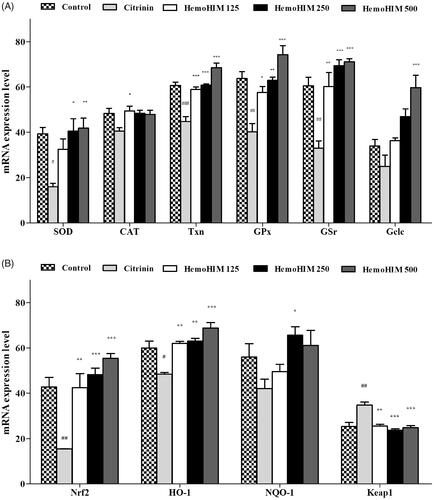
Figure 2. Effect of HemoHIM on levels of (A) SOD, CAT, GPx, GSr, Gclc and (B) Nrf-2, HO-1, NQO-1, Keap1 in citrinin-induced oxidative stress in L6 skeletal muscle cell. Significant difference from control (#p < 0.05, ##p < 0.01, ###p < 0.001) and from citrinin group (*p < 0.05, **p < 0.01, ***p < 0.001).
Figrue 3. Effect of HemoHIM on (A) latency time on rotarod performance and (B) swimming time to exhaustion in FST. Data are expressed as mean ± SEM. Comparison was made between control and HemoHIM groups. Significant difference from control group (*p < 0.05, **p < 0.01).
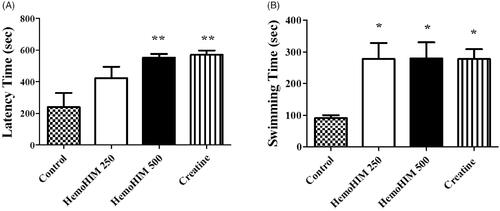
Table 2. Effect of HemoHIM on body weight after exercise performance.
Figure 4. Effect of HemoHIM on (A) glucose concentration and (B) LDH activity in serum after exercise challenge. Data are expressed as mean ± SEM. Comparison was made between control and HemoHIM groups. Significant difference from control group (*p < 0.05, **p < 0.01, ***p < 0.001).
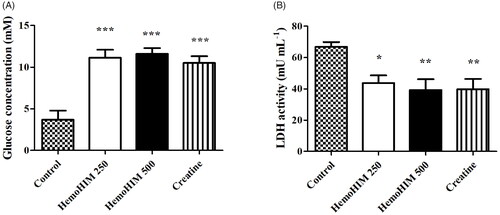
Table 3. Effect of HemoHIM on lactate, creatine kinase, AST and ALT in serum after exercise challenge.
Figure 5. Effect of HemoHIM on (A) MDA content and (B) GPx activity in liver after exercise challenge. Data are expressed as mean ± SEM. Comparison was made between control and HemoHIM groups. Significant difference from control group (*p < 0.05, **p < 0.01, ***p < 0.001).
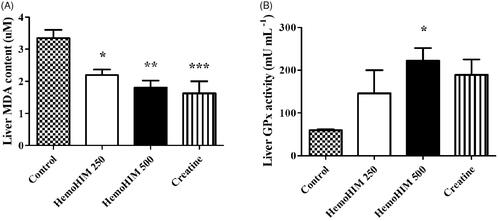
Figure 6. Effect of HemoHIM on (A) glycogen content and (B) LDH activity in muscle after exercise challenge. Data are expressed as mean ± SEM. Comparison was made between control and HemoHIM groups. Significant difference from control group (**p < 0.01, ***p < 0.001).
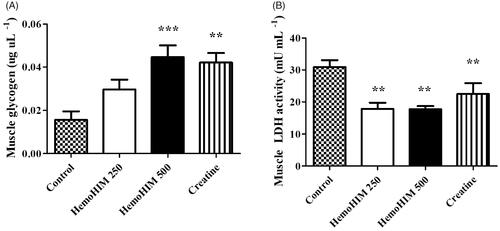
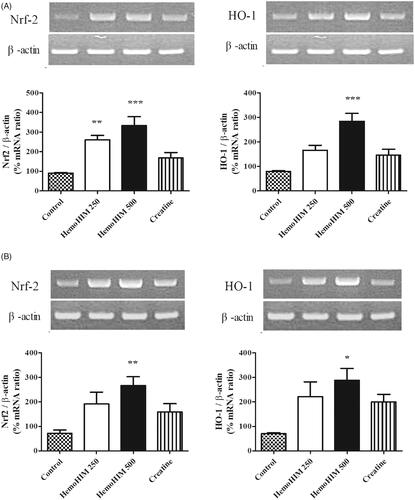
Figure 7. Effects of HemoHIM on (A) Nrf-2 and, HO-1 in liver, and (B) Nrf-2 and, HO-1 mRNA expression levels in muscle using reverse transcriptase PCR after exercise challenge. Data are expressed as mean ± SEM. Comparison was made between control and HemoHIM groups. Significant difference from control group (*p < 0.05, **p < 0.01, ***p < 0.001).