
Figures & data
Figure 1. The gene interaction and the change pattern of cells. (A) The modification pattern for the cell viability and the length of cell’s projections, when APP cells were treated by Fuzi solution of different concentration. Statistically (p ≤ 0.05) and extremely (p ≤ 0.01) significant difference were symbolled as “*” and “**”, and p ≤ 0.1 was symbolled as “#”. (B) The gene interaction pattern for the AD relevant Fuzi target genes.
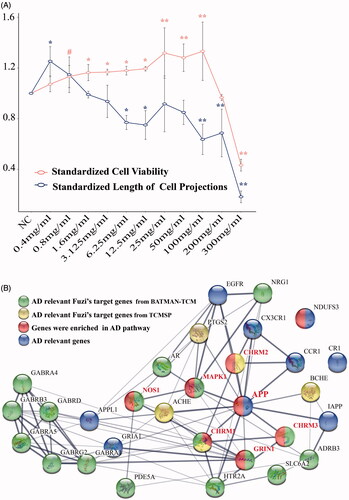
Figure 2. The microscope images for cell morphology. NC symbol the APP cells were not treated by Fuzi. The other images symbol the APP cells were treated by Fuzi solution of different concentration, from 0.4 to 300 mg/ml.
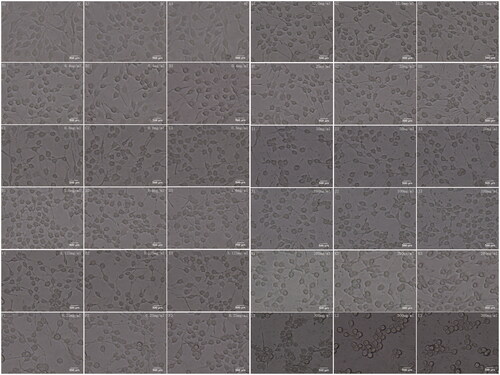
Figure 3. The KEGG pathway of AD.
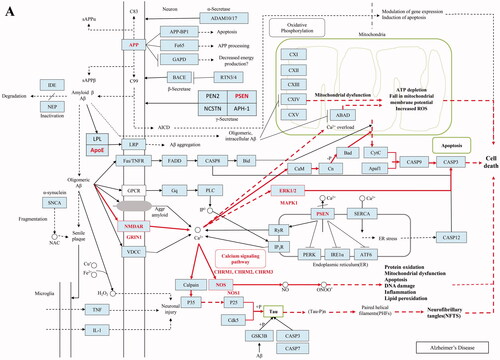
Table 1. The information for the 17 AD relevant target genes of Fuzi.
Table 2. The pathway enrichment results of 17 Fuzi’s target genes.
Table 3. The structure and targets for AD relevant Fuzi’s compounds.
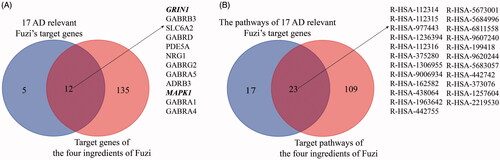
Figure 4. The relationship of 17 candidate genes and 4 compounds (m-aminophenol, o-aminophenol, p-aminophenol, and coryneine) related genes. (A) The crossover relationship of the genes. (B) The crossover relationship of enrichment pathways that the genes enriched in.
Supplementary_Material.docx
Download ()Data availability statement
The authors confirm that the data supporting the findings of this study are available within the article [and/or] its Supplementary materials.