Figures & data
Figure 1. Chemical structures of the isoflavone genistein (1), its glucoside sophoricoside (3), and the flavone apigenin (2).
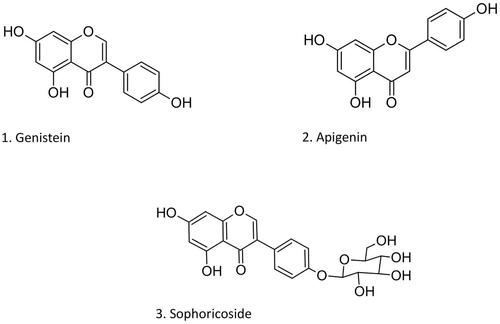
Figure 2. The total absorbance chromatograms (TAC) and total ion chromatograms (TIC) of the reference substances, apigenin (A) and genistein (B) (top) as detected with DAD and their MS (middle) and MS2 (bottom) spectra in the positive ion mode.
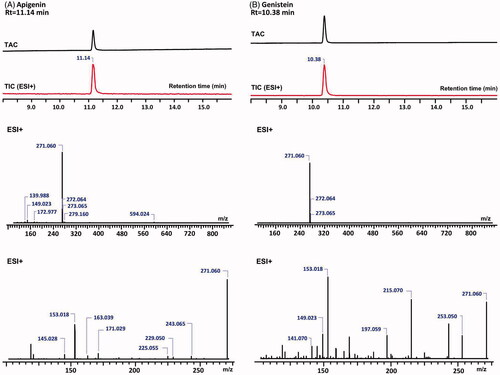
Table 1. Fragmentation pattern of apigenin and genistein.
Figure 3. The total absorbance chromatograms (TAC) and total ion chromatograms (TIC) of G. biloba leaf extract (A) and S. japonica fruit extract (B) (top) as detected with DAD and the identification of apigenin and genistein respectively, with their MS (middle) and MS2 (bottom) spectra in the positive ion mode.
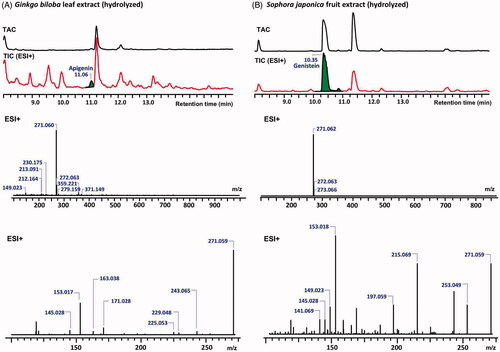
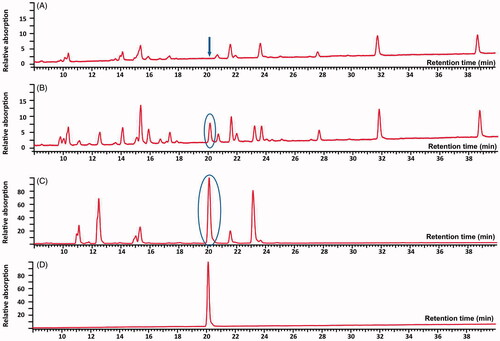
Figure 4. UV-detected chromatograms of G. biloba leaf extract (A), extract of G. biloba leaves with 2% adulteration of S. japonica fruits (B), S. japonica fruit extract (C) and sophoricoside (D) at 254 nm.