Figures & data
Table 1. The sequences of primers.
Table 2. The sequences of miR-92a-3p mimics and inhibitor.
Figure 1. Cell viability after alisol A 24-acetate treatment. (A) Molecular structure of alisol A 24-acetate. (B, C) Experimental designs are displayed in panels (B) and (C). (D) Alisol A 24-acetate had an IC50 of 98.53 mg/L. (E) Cell viability after alisol A 24-acetate measured using the CCK-8 assay. Results are presented as means ± standard deviation (SD) (n = 6).
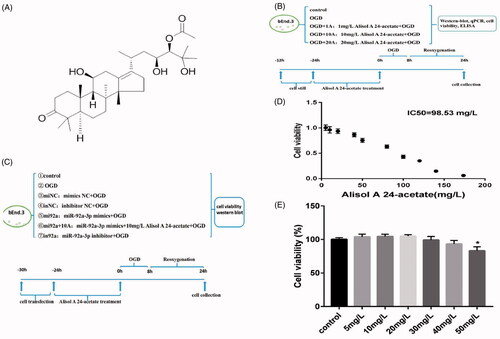
Figure 2. Effects of alisol A 24-acetate on inflammatory factors and oxidative stress in OGD-induced bEnd.3 cells. (A) Secreted IL-1β in cell culture supernatant was determined using ELISA. (B) Secreted TNF-α in cell culture supernatant was determined using ELISA. (C) Superoxide dismutase (SOD) activity in supernatant was detected. (D) Secreted malondialdehyde (MDA) in cell culture supernatant was determined. Results (A–D) are presented as means ± standard deviation (SD) (n = 6) vs. the control group (*p < 0.05, **p < 0.01), vs. the OGD group (#p < 0.05, ##p < 0.01). (E) The inhibitory effect of alisol A 24-acetate on OGD-induced ROS production. DCFH-DA, a fluorescent indicator, was used to visualise ROS, which was observed by confocal microscopy. Scale bar = 70 μm. (F) The quantity of DCFH-DA was measured by Image J software. Results are presented as means ± standard deviation (SD) (n = 3) vs. the control group (*p < 0.05, **p < 0.01), vs. the OGD group (#p < 0.05, ##p < 0.01).
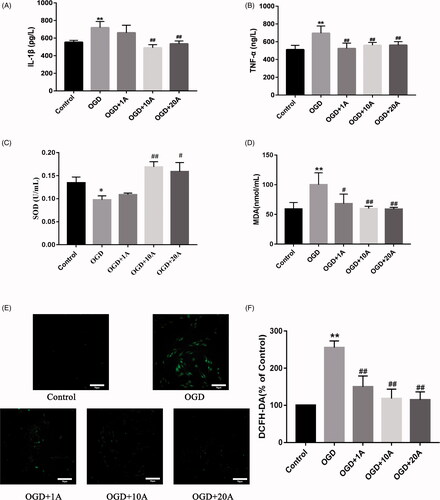
Figure 3. Effects of alisol A 24-acetate on invasion capabilities. Invasion capability was measured (n = 5). The ability of cells migration was measure (n = 5). vs. control group (*p < 0.05), vs. OGD group (#p < 0.05). Results are presented as means ± standard deviation (SD).
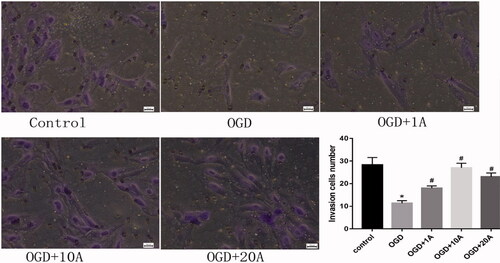
Figure 4. Effects of alisol A 24-acetate on migration capabilities. Cell migration ability was measured (n = 5). vs. the control group (*p < 0.05), vs. the OGD group (#p < 0.05). Results are presented as means ± standard deviation (SD).
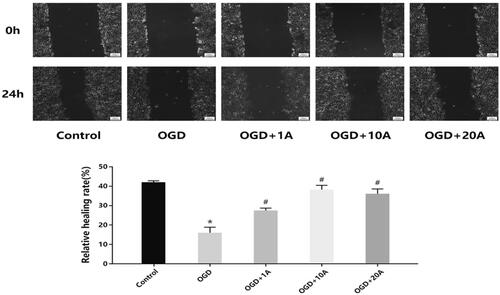
Figure 5. Effects of alisol A 24-acetate on apoptosis of OGD-induced bEnd.3 cells. (A) Apoptosis detected using flow cytometry. (B) Apoptotic ratio was calculated. (C) Western blot analysis to determine Bcl-2 expression. (D) Western blot analysis to determine Bax expression. (E) The Bcl-2/Bax ratio. The graphs represent the relative expression of these proteins over three independent experiments. vs. the control group (*p < 0.05, **p < 0.01), vs. the OGD group (#p < 0.05).
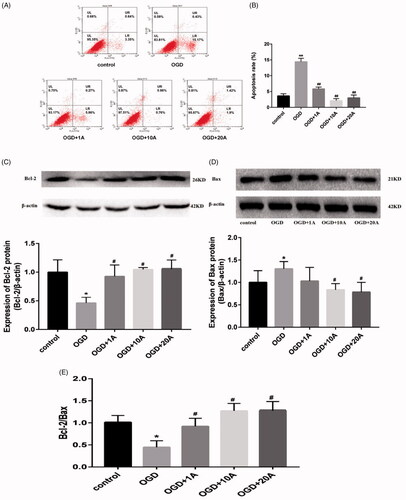
Figure 6. Effects of alisol A 24-acetate on miR-92a-3p expression of OGD-induced bEnd.3 cells. (A) MiR-92a-3p expression in cells detected using quantitative polymerase chain reaction. Results are presented as means ± standard deviation (SD) (n = 6). vs. the control group (**p < 0.01), vs. the oxygen–glucose deprivation group (##p < 0.01). (B) MiR-92a-3p expression after inhibitor and NC transfection (n = 6). (C) MiR-92a-3p expression after mimic and NC transfection (n = 6). vs. the NC group (**p < 0.01).
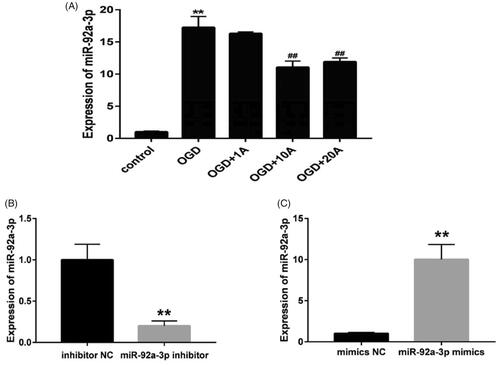
Figure 7. Effects of miR-92a-3p transfection on apoptosis of OGD-induced bEnd.3 cell. (A) Cell apoptosis detected using flow cytometry. (B) Apoptotic ratio was calculated. (C) Western blot analysis to determine of Bcl-2 and Bax expression, with β-actin serving as the loading control. (D) Bcl-2 protein expression. (E) Bax protein expression. (F) The of Bcl-2/Bax ratio. The graphs represent three independent experiments. Results are presented as means ± standard deviation (SD) (n = 3). OGD, miNC, and inNC vs. the control group (**p < 0.01); mi92a, mi92a + 10A, and in92a vs. the OGD group (#p < 0.05, ##p < 0.01); mi92a + 10A and in92a vs. mi92a group (@p < 0.05, @@p < 0.01).
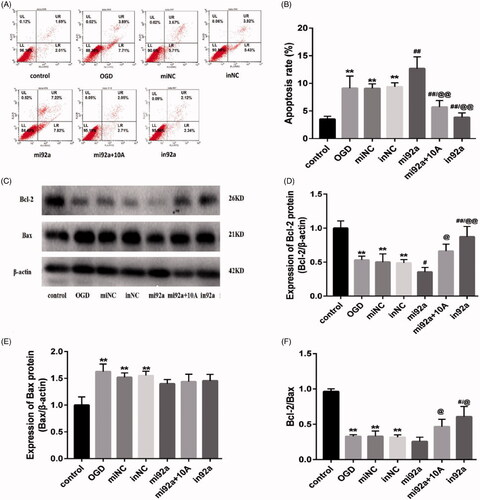
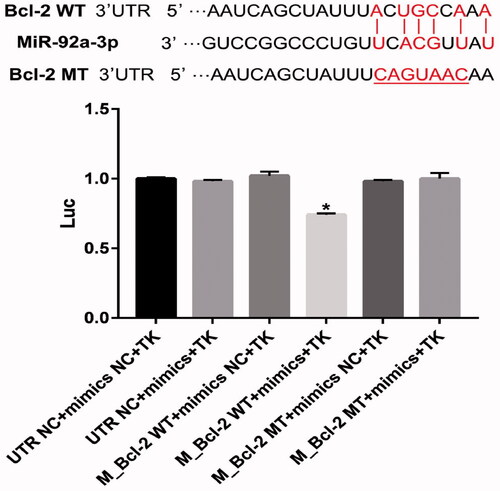
Figure 8. MiR-92a-3p directly targets Bcl-2 gene. Luciferase activity of wild-type Bcl-2 3′-untranslated region (UTR) (WT) or mutant Bcl-2 3′-UTR (mut) with NC mimics or miR-92a-3p-transfected HEK-293 cells. The graphs represent three independent experiments. Results are presented as means ± standard deviation (SD) (n = 3) (*p < 0.05).