
Figures & data
Figure 1. Bryophyllum pinnatum plant.
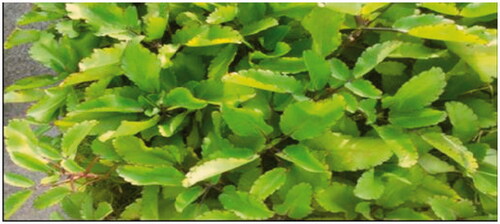
Figure 2. Overlay of UPLC chromatogram at 280 nm top and base peak intensity (BPI) chromatograms (bottom) of BPFRF.
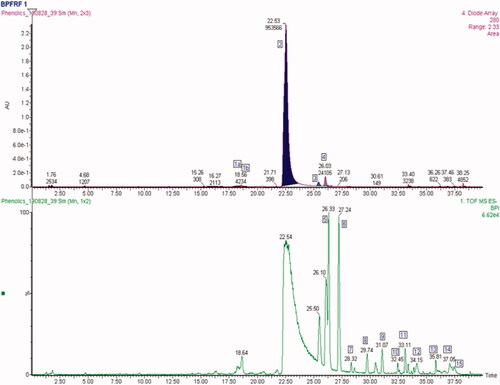
Figure 3. Photodiode array detector (PDA) spectra and mass spectra (MS/MS) fragmentation pattern present in B. pinnatum flavonoid-rich fraction (BPFRF). Luteolin C-glucoside-C-arabinoside (carlinoside) (A). Quercetin (B). Luteolin (C). Quercetin-3-methyl ether (isorhamnetin) (D). Luteolin-7-glucoside (E).
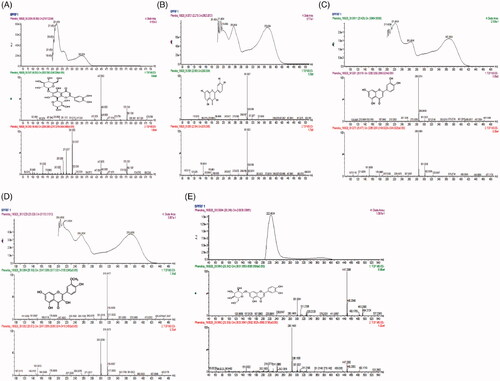
Table 1. Constituents of BPFRF identified and characterized by UPLC-PDA-Q/TOF-MS2 analysis.
Figure 4. 2,2-Diphenyl-1-picrylhydrazyl free radical scavenging effect of BPFRF in comparison with ascorbic acid (3.125–100 μg/mL).
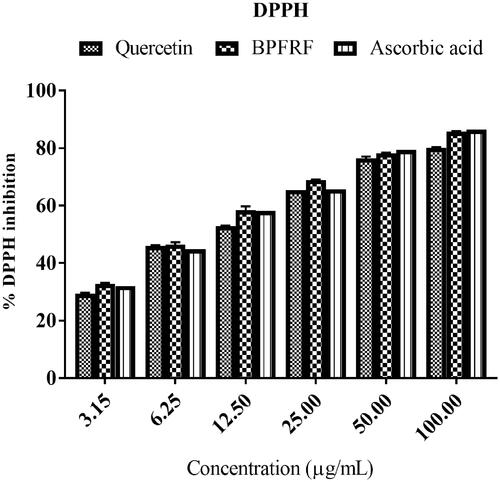
Table 2. DPPH radical scavenging potential, lipid peroxidation inhibitory activity and cholinesterase inhibitory activity of BPFRF, quercetin and standards.
Figure 5. Fe2+-induced lipid peroxidation inhibitory activity of BPFRF and the ascorbic acid.
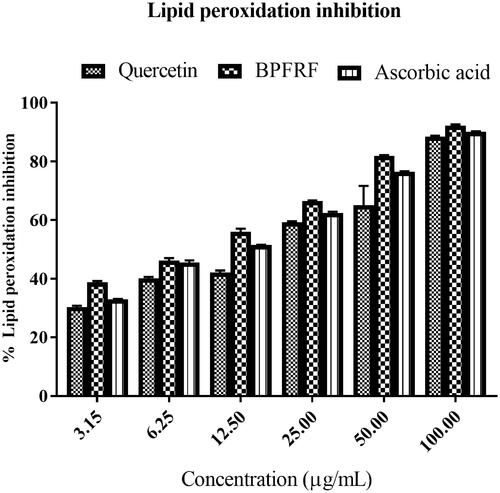
Figure 6. Cholinesterase inhibitory activity of BPFRF AChE (A). BuChE (B).
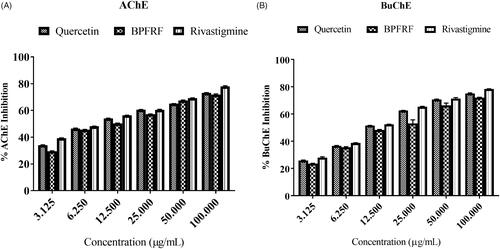
Table 3. Binding energies of BPFRF ligands and known inhibitors against AChE and BuChE drug targets.
Figure 7. Illustrations of molecular interactions (left: 3D and right: 2D) between the/highest binding energies of BPFRF constituents and standard against AChE target. Luteolin-7-glucoside (red) (Ai, Aii). Quercetin (orange) (Bi, Bii). Rivastigmine (purple) (Ci, Cii).
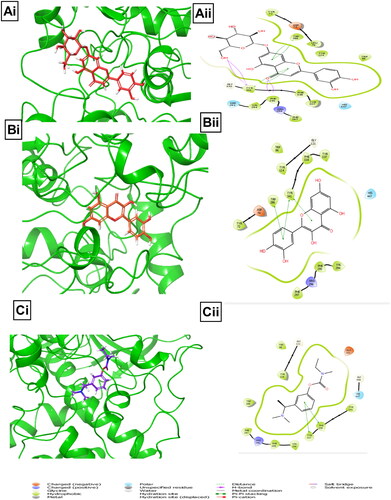
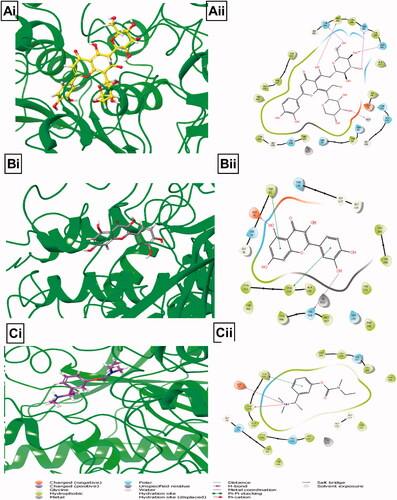
Figure 8. Illustrations of molecular interactions (left: 3D and right: 2D) between the highest binding energies of BPFRF constituents and standard against BuChE target. Carlinoside (yellow) (Ai, Aii). Quercetin (grey) (Bi, Bii). Rivastigmine (purple) (Ci, Cii).
Supplementary_Data_PHB.doc
Download ()Data availability statement
The data that support the findings of this study are available from the authors upon request.