
Figures & data
Figure 1. Chemical structures of poziotinib (A), M1 (B), M2 (C) and enasidenib (D).
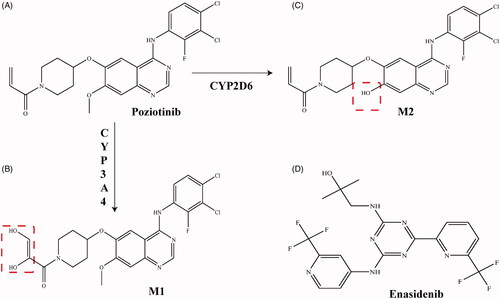
Figure 2. MRM chromatograms of poziotinib and IS. (1) Blank plasma sample, (2) blank plasma sample with poziotinib (LLOQ) and IS, and (3) plasma sample 2 h after dosing poziotinib with oral administration.
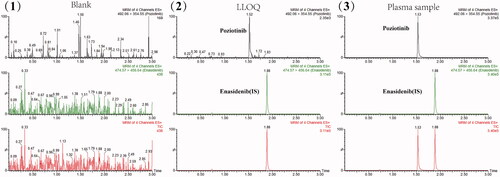
Table 1. Inter- and intraday precision, accuracy, recovery and matrix of poziotinib in rat plasma (n = 6, mean ± SD).
Figure 3. Mean plasma concentration–time curves of poziotinib in the test and control groups.
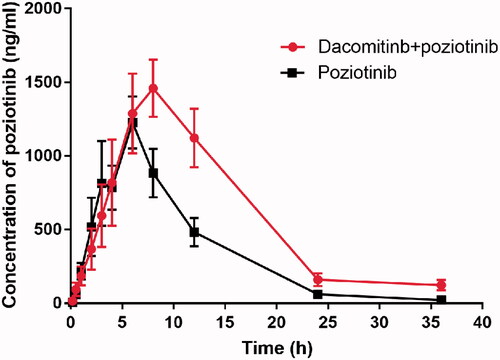
Table 2. Main pharmacokinetic parameters of poziotinib in the two groups (n = 6, mean ± SD).
Figure 4. Michaelis–Menten kinetics of poziotinib in RLM (A) and HLM (B).
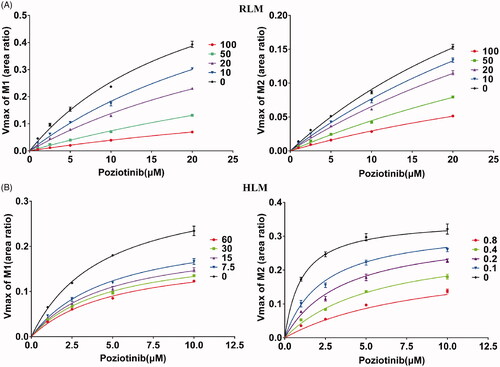
Figure 5. Poziotinib with various concentrations to determine the IC50 for the activity of RLM (A, B), HLM (C, D), CYP3A4 (E) and CYP2D6 (F).
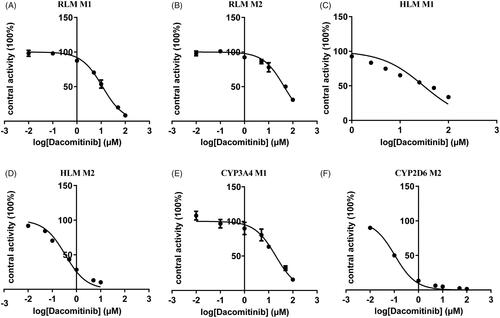
Figure 6. Lineweaver–Burk plots and the secondary plot for Ki of the inhibition of poziotinib metabolism by dacomitinib in RLM (A, B) and HLM (C, D).
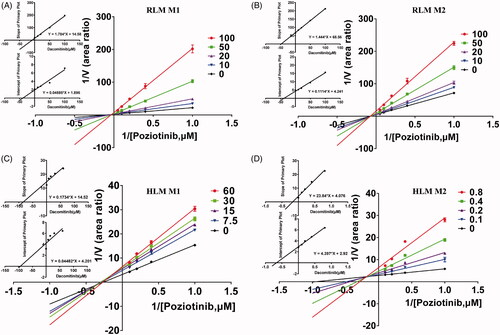
Table 3. The IC50 values and inhibitory effects of dacomitinib on poziotinib metabolism in RLM, HLM, CYP3A4 and CYP2D6.