
Figures & data
Figure 1. CT attenuates the infarct region in the MCAO model. (A) The serum levels of alanine transaminase (ALT), aspartate aminotransferase (AST), blood urea nitrogen (BUN), and creatinine (Cr) were assessed to evaluate hepatorenal function. * p < 0.05 vs. NC, *** p < 0.001 vs. NC. (B) The infarct region of rats subjected to MCAO and CT treatments were examined by the triphenyltetrazolium chloride (TTC)-stained assay. *** p < 0.001 vs. NC; ## p < 0.01 vs. Model, ### p < 0.001 vs. Model;! p < 0.05 vs. Model + C15 (C) Haematoxylin-eosin (HE) stained serial coronal brain sections from rats subjected to MCAO and CT treatments. Magnification, 200 ×. *** p < 0.001 vs. NC; ## p < 0.01 vs. NC; ### p < 0.001 vs. Model.
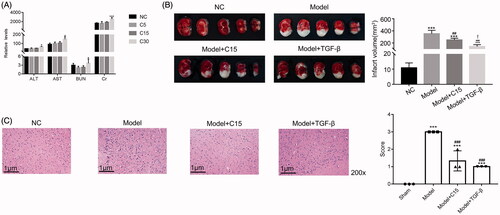
Figure 2. CT-targeted STAT5 in mononuclear cells of the MCAO model. (A) CT treatment promoted the number of CD25+FOXP3+ Treg cells in the mononuclear cells of the MCAO model. *** p < 0.001 vs. NC; ### p < 0.001 vs. Model. (B) Western blotting was used to examine the protein levels of FOXP3, STAT5, p-STAT5 and IL-2 in different mononuclear cells, as indicated. * p < 0.05 vs. NC, ** p < 0.01 vs. NC, *** p < 0.001 vs. NC; ### p < 0.001 vs. Model.
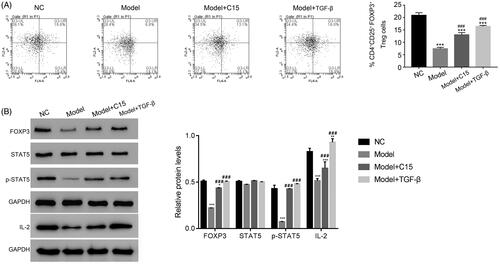
Figure 3. CT promotes the production of CD25+FOXP3+ Treg cells in CD4+ T cells of the MCAO model. * p < 0.05 vs. BLANK, ** p < 0.01 vs. BLANK, *** p < 0.001 vs. BLANK; # p < 0.05 vs. NC; ## p < 0.01 vs. NC; ### p < 0.001 vs. NC. C100, C250, C500 and C1000 means the cryptotanshinone in the concentration of 100, 250, 500 and 1000 µg/mL, respectively.
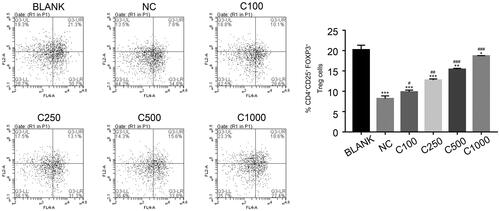
Figure 4. The effect of CT was abolished by the STAT5 inhibitor STAT5-IN-1 in. (A) The production of CD25+FOXP3+ cells was inhibited by treatment with the STAT5-IN-1 inhibitor in CD4+ T cells with the treatment of CT. *** p < 0.001 vs. NC; ### p < 0.001 vs. C500. (B) The protein levels of FOXP3 and p-STAT5 were suppressed by the inhibitor STAT5-IN-1 in CD4+ T cells with the treatment of CT. *** p < 0.001 vs. NC; ### p < 0.001 vs. C500.
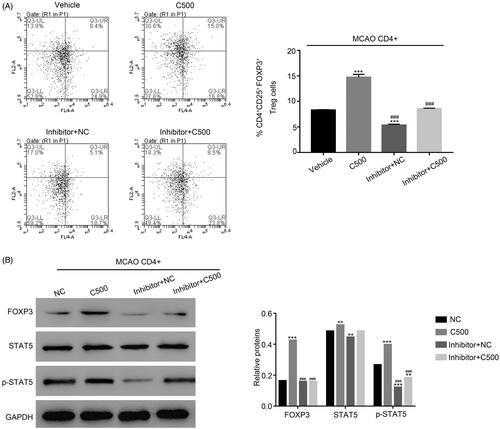
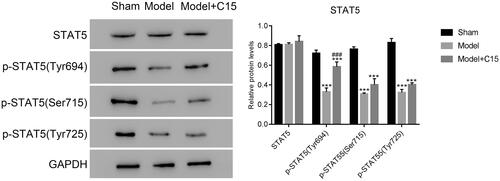
Figure 5. CT treatment increased levels of phosphorylated STAT5 at Tyr694 in the MCAO model. ***p < 0.001 vs. Sham; ###p < 0.001 vs. Model.