Figures & data
Figure 1. Graphical abstract.
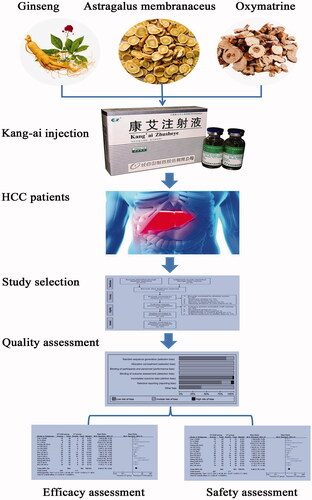
Figure 2. Study selection process for the meta-analysis.
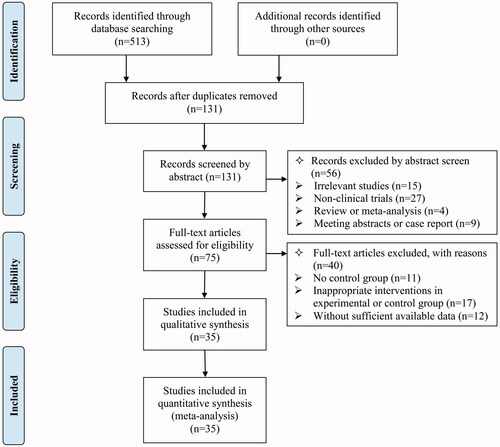
Table 1. Characteristics of the included studies.
Figure 3. Risk of bias summary. Review of authors’ judgments about each risk of bias item for included studies. (a) Random sequence generation (selection bias); (b) Allocation concealment (selection bias); (c) Blinding of participants and personnel (performance bias); (d) Blinding of outcome assessment (detection bias); (e) Incomplete outcome data (attrition bias); (f) Selective reporting (reporting bias); (g) Other bias. Each colour represents a different level of bias: red for high-risk, green for low-risk, and yellow for unclear-risk of bias.
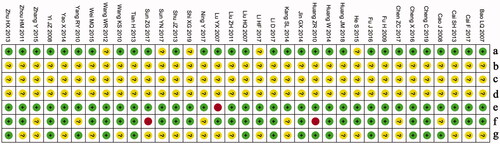
Figure 4. Risk of bias graph. Review of authors’ judgments about each risk of bias item presented as percentages across all included studies. Each colour represents a different level of bias: red for high-risk, green for low-risk, and yellow for unclear-risk of bias.
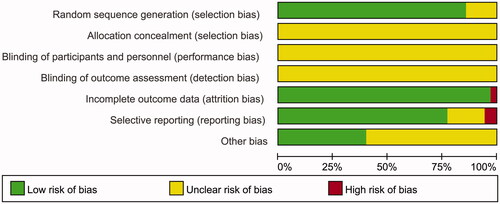
Figure 5. Comparisons of ORR between experimental and control group. Forest plot of the comparison of ORR between the experimental and control group. Control group, conventional treatment alone group; Experimental group, conventional treatment and KAI combined group. The fixed-effects meta-analysis model (Mantel–Haenszel method) was used.
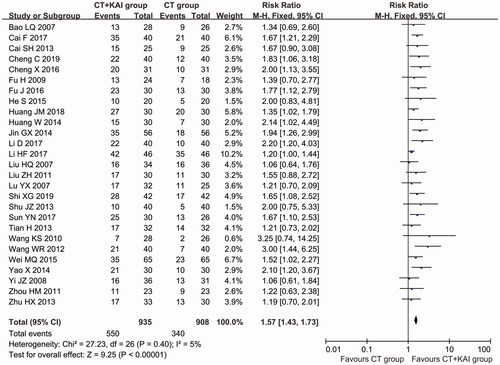
Figure 6. Comparisons of DCR between experimental and control group. Forest plot of the comparison of DCR between the experimental and control group. Control group, conventional treatment alone group; Experimental group, conventional treatment and KAI combined group. The random effects meta-analysis model (Inverse Variance method) was used.
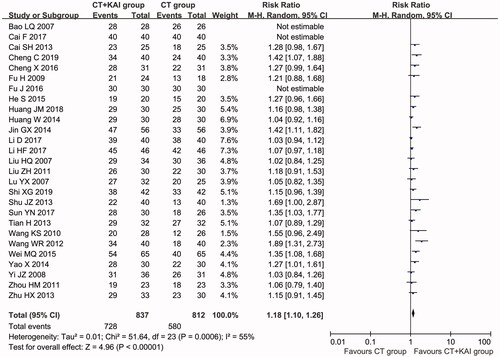
Figure 7. Comparisons of QoL between experimental and control group. Forest plot of the comparison of QoL between the experimental and control group. Control group, conventional treatment alone group; Experimental group, conventional treatment and KAI combined group. The random effects meta-analysis model (Inverse Variance method) was used.
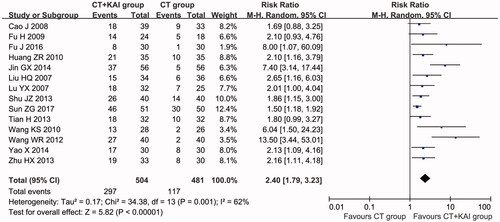
Table 2. Comparison of adverse events between the experimental and control group.
Table 3. Evaluation of publication bias by trim-and-fill method.
Figure 8. Funnel plot of ORR (A) and DCR (B).
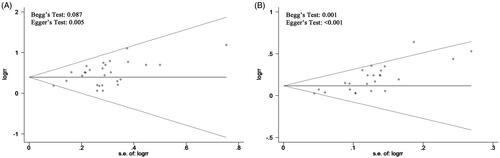
Table 4. Subgroup analyses of ORR and DCR between the experimental and control group.
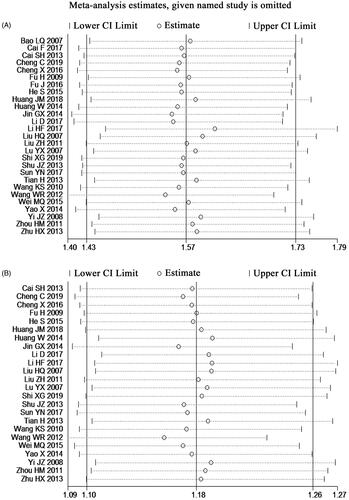
Figure 9. Sensitivity analysis for ORR (A) and DCR (B).