
Figures & data
Figure 1. Cholesterol, LDL and HDL levels at different time points in LC group, LC + tocopheryl quinone group, HFCC group and HFCC + tocopheryl quinone group. The treatment with HFCC and tocopheryl quinone increased and decreased the levels of cholesterol, LDL and HDL, respectively (n = 3; *p value < 0.05 vs. LC group; #p value < 0.05 vs. HFCC group). (A) Cholesterol levels in the four groups in weeks 0, 2, 4, 6, 8, 10 and 12; (B) Area under the curve of cholesterol levels in the four groups; (C) LDL levels in the four groups in weeks 0, 2, 4, 6, 8, 10 and 12; (D) Area under the curve of LDL levels in the four groups; (E) HDL levels in the four groups in weeks 0, 2, 4, 6, 8, 10 and 12; (F) Area under the curve of HDL levels in the four groups.
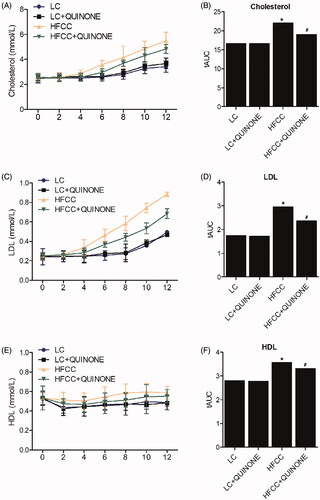
Figure 2. OGTT at different time points in LC group, LC + tocopheryl quinone group, HFCC group and HFCC + tocopheryl quinone group. The treatment with HFCC and tocopheryl quinone increased and decreased the levels of blood glucose, respectively (n = 3; *p value < 0.05 vs. LC group; #p value < 0.05 vs. HFCC group). (A) Blood glucose levels at different time points in the four groups; (B) Area under the curve of blood glucose levels in the four groups. (C) H&E staining of liver tissue samples in the four groups.
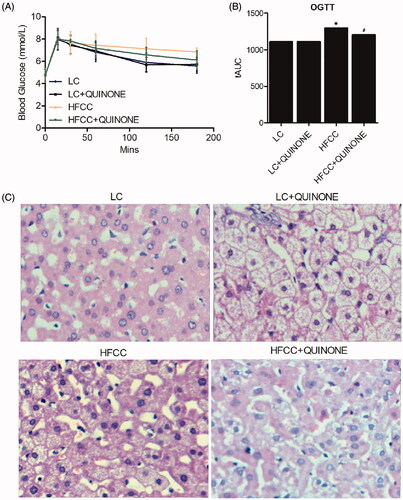
Figure 3. Expression levels of MDA, GSH, SOD, vitamin E, 12-HETE, 13-HODE and NF-κB in LC group, LC + tocopheryl quinone group, HFCC group and HFCC + tocopheryl quinone group. The treatment with HFCC and tocopheryl quinone increased and decreased the levels of redox indicators, respectively (n = 3; *p value < 0.05 vs. LC group; #p value < 0.05 vs. HFCC group). (A) Serum MDA levels in the four groups; (B) Serum GSH levels in the four groups; (C) Serum SOD levels in the four groups; (D) MDA levels of intestinal tissues in the four groups; (E) GSH levels of intestinal tissues in the four groups; (F) SOD levels of intestinal tissues in the four groups; (G) Vitamin E levels of intestinal tissues in the four groups; (H) 12-HETE levels of intestinal tissues in the four groups; (I) 13-HODE levels of intestinal tissues in the four groups; (J) NF-κB activity of intestinal tissues in the four groups.
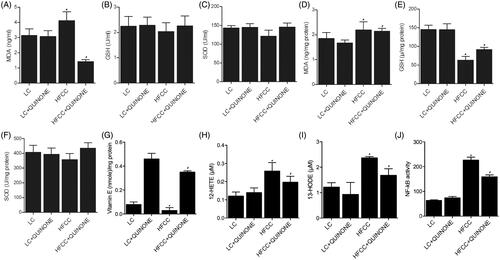
Figure 4. A 16S ribosomal ribonucleic acid–based analysis was used to test the intestinal flora in LC group, LC + tocopheryl quinone group, HFCC group and HFCC + tocopheryl quinone group (n = 3; *p value < 0.05 vs. LC group; #p value < 0.05 vs. HFCC group). (A) Total number of bacteria in the four groups. The treatment with HFCC and tocopheryl quinone decreased and increased the total number of bacteria, respectively; (B) Number of Clostridium in the four groups. The treatment with HFCC and tocopheryl quinone decreased and increased the number of Clostridium, respectively; (C) Number of Bacteroides in the four groups. The treatment with HFCC and tocopheryl quinone decreased and increased the number of Bacteroides, respectively; (D) Number of Lactobacilli in the four groups. The treatment with HFCC and tocopheryl quinone decreased and increased the number of Lactobacilli, respectively; (E) Number of Bifidobacteria in the four groups. The treatment with HFCC and tocopheryl quinone decreased and increased the number of Bifidobacteria, respectively.
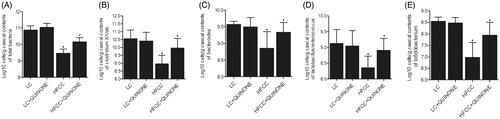
Figure 5. IHC was conducted to test the levels of GLP-1 in LC group, LC + tocopheryl quinone group, HFCC group and HFCC + tocopheryl quinone group. The treatment with HFCC and tocopheryl quinone increased and decreased the levels of GLP-1, respectively (n = 3, the brown as arrow-pointed denotes the expression of GLP-1).
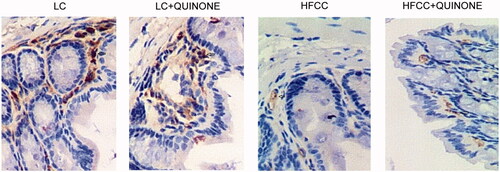
Figure 6. WB and ELISA were used to test the levels of GLP-1 in LC group, LC + tocopheryl quinone group, HFCC group and HFCC + tocopheryl quinone group (n = 3; *p value < 0.05 vs. LC group; #p value < 0.05 vs. HFCC group). (A) Tissue levels of GLP-1 in the four groups were detected by WB. The treatment with tocopheryl quinone increased the expression of GLP-1 in the HFCC group; (B) Plasma levels of GLP-1 in the four groups were detected by ELISA. The treatment with tocopheryl quinone increased the expression of GLP-1 in the HFCC group; (C) Tissue activity of GLP-1 in the four groups was detected by ELISA. The treatment with tocopheryl quinone increased GLP-1 activity in the HFCC group; (D) Tissue IL-6 activity in the four groups was detected by ELISA. The treatment with tocopheryl quinone decreased IL-6 activity in the HFCC group; (E) Tissue TNF-α expression in the four groups was detected by ELISA. The treatment with tocopheryl quinone suppressed the expression of TNF-α in the HFCC group; (F) The expression of endotoxins in the HFCC group was reduced by the treatment with tocopheryl quinone.
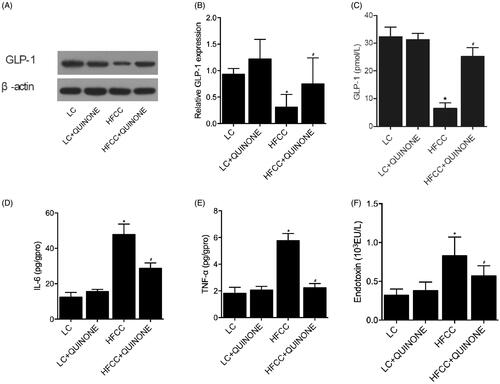
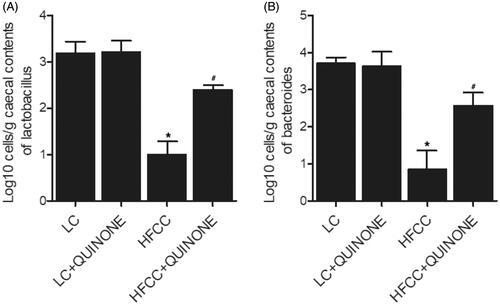
Figure 7. Effect of tocopheryl quinone on the growth of bacteria (n = 3; *p value < 0.05 vs. LC group; #p value < 0.05 vs. HFCC group). (A) Treatment with tocopheryl quinone significantly promoted the growth of Lactobacilli; (B) Treatment with tocopheryl quinone significantly promoted the growth of Bacteroides.
Data availability statement
The data sets generated during and/or analysed during this study are available from the corresponding author on reasonable request.