Figures & data
Figure 1. Neurological and cognitive function of HE mice. (A) Neurological score of mice 24 h after TAA injection. (B) Neurological score of mice 24 h after DMY injection. (C) Cognitive function of mice 24 h after TAA injection. (D) Cognitive function of mice 24 h after DMY injection. DMY: DMY-treated (5 mg/kg) group; TAA: TAA-treated (600 mg/kg) group; TAA + DMY: TAA-treated (600 mg/kg) + DMY-treated (5 mg/kg) group. Values are expressed as mean ± SD (n = 8). *p < 0.05 and ***p < 0.001 vs. control; ###p < 0.001 vs. TAA.
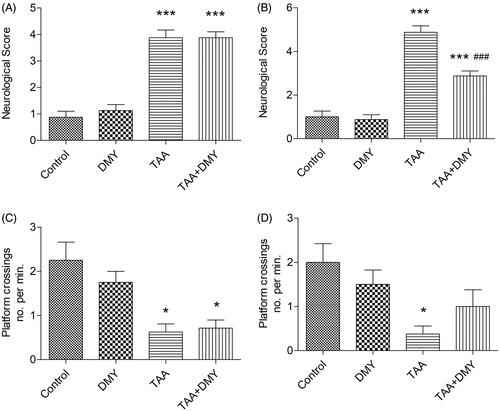
Figure 2. H&E staining of the liver (200×). The histopathology of control and DMY groups shows normal liver architecture. In TAA group, the liver shows a massive hepatocellular necrosis in some part of the liver; the necrosis is focal but not diffuse. In the TAA + DMY group, hepatocytes were hypertrophied with many cytoplasmic vacuoles and oedematous enlarged nuclei, indicating hepatocellular degeneration. Mild mononuclear infiltration was also observed around the central vein. Hepatocellular injury is clearly milder in the TAA + DMY than the TAA group. HC: hepatocytes; CV: central vein; VH: vacuolated hepatocytes.
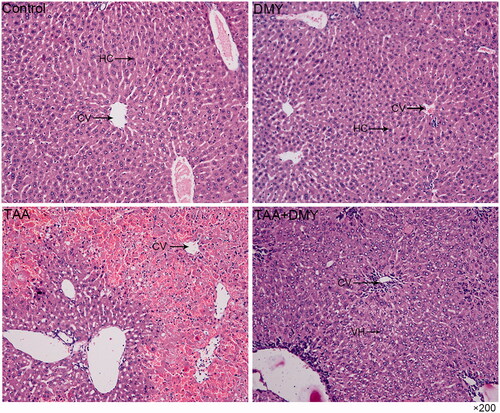
Figure 3. Liver function. (A) The level of SOD. (B) The level of MDA. (C) The level of GST. DMY: DMY-treated (5 mg/kg) group; TAA: TAA-treated (600 mg/kg) group; TAA + DMY: TAA-treated (600 mg/kg) + DMY-treated (5 mg/kg) group. Values are expressed as mean ± SD (n = 8). *p < 0.05, **p < 0.01, and ***p < 0.001.
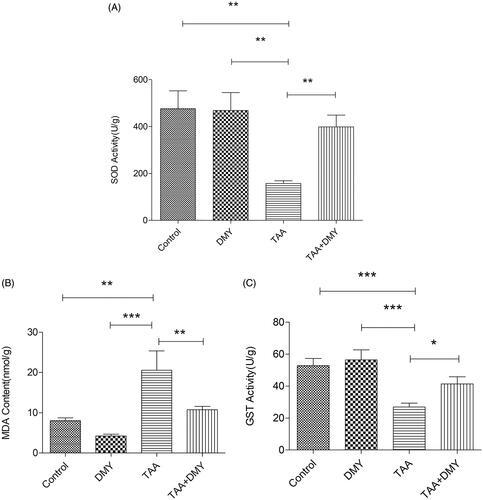
Table 1. Hepatic biochemistry.
Figure 4. Immunohistochemistry of the hippocampus (200×). GFAP (+) astrocytes were not obvious in naive controls (A, B), but they were significantly increased in TAA-treated mice (C, D). DMY administration had no effect on the activation of astrocytes in group B. DMY treatment significantly reduced the number of activated astrocytes in group D compared to group C. (E) Hippocampus GFAP (+) astrocyte score was quantified. DMY: DMY-treated (5 mg/kg) group; TAA: TAA-treated (600 mg/kg) group; TAA + DMY: TAA-treated (600 mg/kg) + DMY-treated (5 mg/kg) group. Values are expressed as mean ± SD (n = 8). **p < 0.01 and ***p < 0.001 vs. control; ##p < 0.01 vs. TAA.
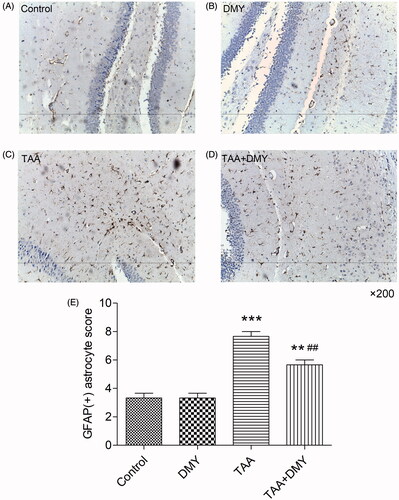
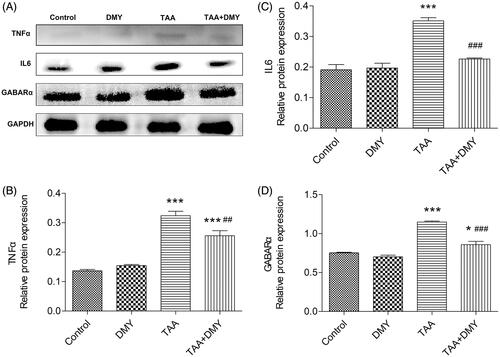
Figure 5. Western blot analysis. (A) Protein levels of TNF-α, IL-6, and GABAA in the cortex. Relative protein expression was quantified using Image J. (B) Relative protein expression of TNF-α. (C) Relative protein expression of IL-6. (D) Relative protein expression of GABAA. DMY: DMY-treated (5 mg/kg) group; TAA: TAA-treated (600 mg/kg) group; TAA + DMY: TAA-treated (600 mg/kg) + DMY-treated (5 mg/kg) group. Values are expressed as mean ± SD (n = 8). *p < 0.05 and ***p < 0.001 vs. control; ##p < 0.01 and ###p < 0.001 vs. TAA.