
Figures & data
Figure 1. Component-target-disease interaction network of LHQW against inflammation.
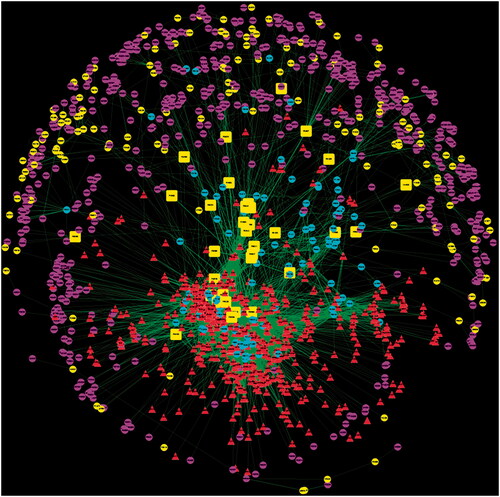
Table 1. Detailed information about 43 batches of LHQW samples.
Table 2. Targets and related topological parameters of LHQW against inflammation.
Table 3. Top 10 components related to putative direct targets.
Figure 2. Putative direct targets of LHQW against inflammation.
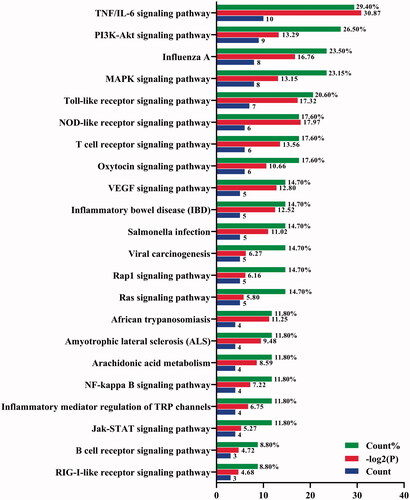
Figure 3. Five kinds of inflammation-related cells associated with LHQW.
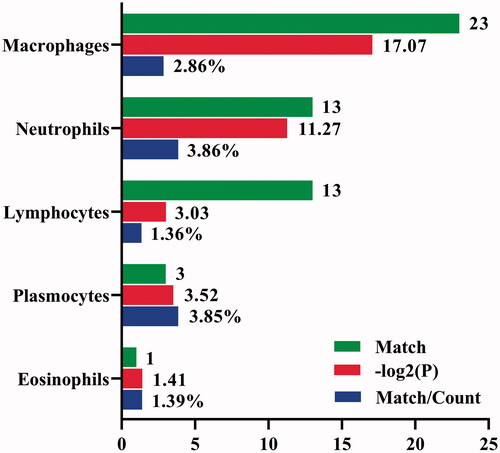
Figure 4. LHQW inhibited IL-6 expression in RAW 264.7 cells. (A) The cells were treated with LPS (1 μg/mL) for 6, 12 and 24 h. (B) The influence of LPS (0.25, 0.5, 1.0 and 2.0 μg/mL), IFN-γ (0.05, 0.1, 0.2 and 0.4 μg/mL), and the combined stimulation on the expression of IL-6. (C) Cell viability in different concentrations of LHQW (100–1000 μg/mL). (D) Effects of LHQW (containing marketed and destructed sample) on the expression of IL-6. S40 represent the marketed sample, and S40a represent the destructed sample with high temperature. **p < 0.01 vs. control group, #p < 0.05, ##p < 0.01 vs. model group.
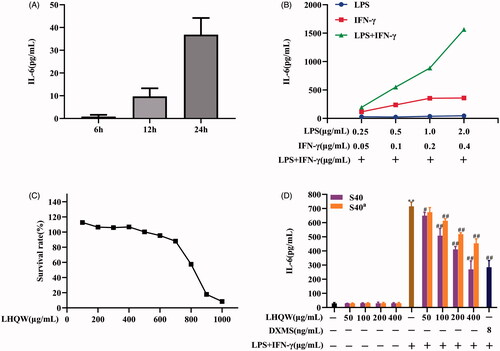
Figure 5. Validation of bioassay of IL-6 for LHQW. (A) The relationship between concentration and inhibition rate. (B) The relationship between logarithmic doses and probit. (C), (D) The biopotency and content of forsythin in 40 batches of marketed samples. (E), (F) The biopotency and content of forsythin in S40, S40a, S40b and S40c. S01-S40 represent the marketed samples, and S40a, S40b and S40c represent the destructed samples with high temperature, high humidity and light intensity. The biopotency of other samples was calculated based on that of S40. CV: coefficient of variation.
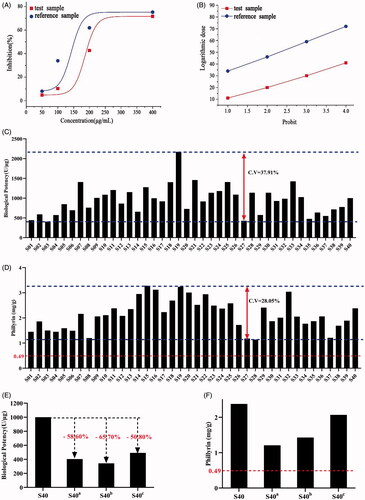
Table 4. Biopotency conversion between LHQW (batch) S40 and DXMS.