Figures & data
Table 1. The primer sequences of targeted RNA.
Figure 1. A diagram of the experiment design in rats.
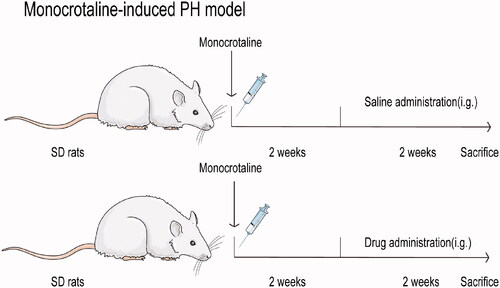
Figure 2. Effects of PDGF-BB, SIL and XMA on proliferation of PASMCs. (A) Effects of PDGF-BB on proliferation of PASMCs with different concentrations and different times were assessed by CCK8 assay. (B, C) The cytotoxicity of SIL and XMA on cells with different concentrations for 48 h. (D, E) Effects of SIL and XMA on proliferation of 40 ng/mL PDGF-BB induced PASMCs. Data are presented as the mean ± SEM. (n = 3). *p < 0.05, **p < 0.01 vs. control. #p < 0.05, ##p < 0.01 vs. PDGF-BB group.
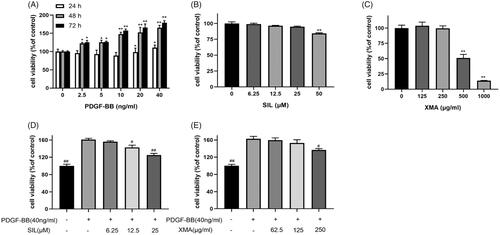
Figure 3. Effects of SIL and XMA administered separately or in combination on proliferation and migration of PASMCs. (A) Effects of SIL in combination with XMA on proliferation of cells. (B, C) Effects of SIL in combination with XMA on migration of cells by wound healing. (D, E) Effects of SIL in combination with XMA on migration of cells by transwell migrations. (F–H) The expression of MMP2 and MMP9 were analyzed with western blotting and the protein expression ratio of MMP2 and MMP9 to GAPDH was evaluated. Data are presented as the mean ± SEM. (n = 3). *p < 0.05, **p < 0.01 vs. PDGF-BB group; #p < 0.05, ##p < 0.01 vs. SIL + XMA group.
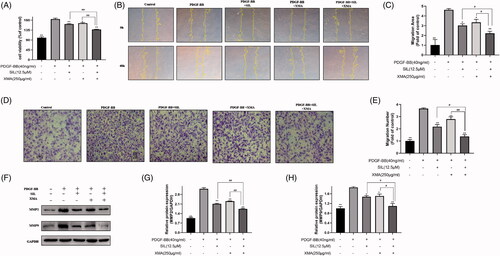
Figure 4. Effects of SIL and XMA administered separately or in combination on apoptosis of PASMCs. (A, B) The apoptosis of PASMCs was detected by flow cytometry by staining with Annexin V + PI. (C) JC-1 staining. (D–F) The expression of BAX, Bcl2, Cleaved-Caspase 3 and Caspase were analyzed with western blotting and the protein expression ratio of BAX/Bcl2, Cleaved-Caspase 3/Caspase was evaluated. Data are presented as the mean ± SEM. (n = 3). *p < 0.05, **p < 0.01 vs. PDGF-BB group; #p < 0.05, ##p < 0.01 vs. SIL + XMA group.
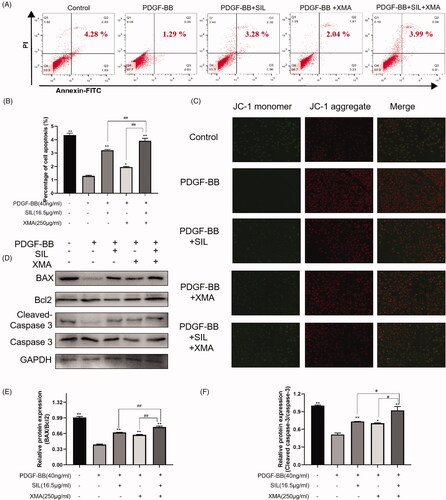
Figure 5. Effects of SIL and XMA administered separately or in combination on oxidative stress levels. (A) The level of ROS in PASMCs. (B) The level of MDA in PASMCs. (C) The level of IL-1β in PASMCs. (D)The level of IL-6 in PASMCs. (E) The level of TNF-α in PASMCs. Data are presented as the mean ± SEM. (n = 3). *p < 0.05, **p < 0.01 vs. PDGF-BB group; #p < 0.05, ##p < 0.01 vs. SIL + XMA group.
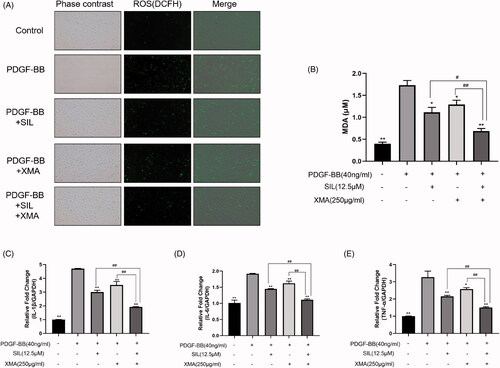
Figure 6. Effects of SIL and XMA administered separately or in combination on RVSP and RV remodelling in rats with MCT-induced PH rats. (A) Representative pictures of RVSP waves in each group. (B) RVSP. (C) Representative photomicrographs from heart tissues with Masson staining. (D) Mean cross section area (CSA) of cardiomyocytes was evaluated based on the results of Masson. (E) RV/LV + S ratio. (F) RV/body weight ratio. (G–I) The expression of MMP2 and MMP9 were analyzed with western blotting and the protein expression ratio of MMP2, MMP9 to β-actin was evaluated. Group I:control group received saline; Group II: MCT group received MCT(60 mg/kg); Group III: SIL-Low group received MCT + SIL at 10 mg/kg/day; Group IV: SIL-high group received MCT + SIL at 30 mg/kg/day; Group V: XMA-High group received MCT + XMA at 62.9 mg/kg/day; Group VI: SIL(Low)+XMA(Low) group received SIL(10 mg/kg) + XMA at 125.8 mg/kg/day; Group VII: SIL(Low)+XMA(Medium) group received SIL(10 mg/kg) + XMA at 251.6 mg/kg/day; Group VIII: SIL(Low)+XMA(High) group received SIL(10 mg/kg) + XMA at 251.6 mg/kg/day. Data are presented as the mean ± SEM. (n = 6–8). *p < 0.05, **p < 0.01 vs. Group II; #p < 0.05, ##p < 0.01 vs. Group VIII.
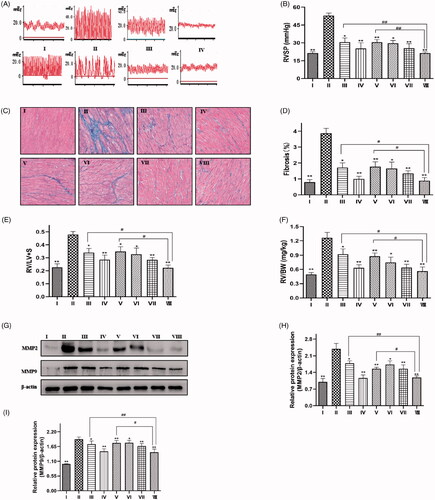
Figure 7. Effects of SIL and XMA administered separately or in combination on pulmonary arterial remodelling in rats with MCT-induced PH rats. (A) HE staining showing representative micrographs of pulmonary artery remodelling. (B) Quantitative analysis of the percentage of medial arteriole thickness. (C) A representative image of the immunohistochemical staining for alpha smooth muscle actin (α-SMA) antibody. (D) The proportion of muscularized small pulmonary arteries. (E, F) The expression of α-SMA were analyzed by western blotting and the protein expression ratio of α-SMA to β-actin was evaluated. Group I:control group received saline; Group II: MCT group received MCT(60 mg/kg); Group III: SIL-Low group received MCT + SIL at 10 mg/kg/day; Group IV: SIL-high group received MCT + SIL at 30 mg/kg/day; Group V: XMA-High group received MCT + XMA at 62.9 mg/kg/day; Group VI: SIL(Low) +XMA (Low) group received SIL(10 mg/kg) + XMA at 125.8 mg/kg/day; Group VII: SIL(Low)+XMA(Medium) group received SIL(10 mg/kg) + XMA at 251.6 mg/kg/day; Group VIII: SIL(Low)+XMA(High) group received SIL(10 mg/kg) + XMA at 251.6 mg/kg/day. Data are presented as the mean ± SEM. (n = 6–8). *p < 0.05, **p < 0.01 vs. Group II; #p < 0.05, ##p < 0.01 vs. Group VIII.
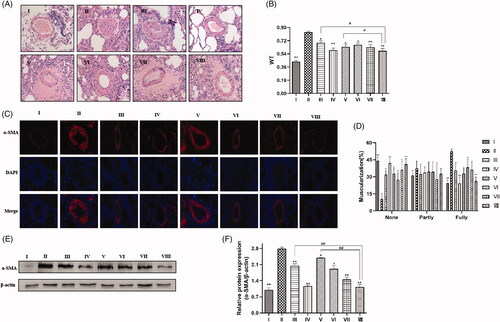
Figure 8. Effects of SIL and XMA administered separately or in combination could inhibit MAPK signalling pathway in vitro and in vivo. (A-D) The expression of p-ERK, ERK, p-JNK, JNK, p-p38MAPK and p38MAPK in PASMCs were assayed by Western blot. The phosphorylated protein bands were standardized to total protein expression bands. Data are presented as the mean ± SEM. *p < 0.05, **p < 0.01 vs. PDGF-BB group; #p < 0.05, ##p < 0.01 vs. SIL+XMA group. (EH) The expression of p-ERK, ERK, p-JNK, JNK, p-p38MAPK and p38MAPK in lung were assayed by Western blot. The phosphorylated protein bands were standardized to total protein expression bands. (I-L) The expression of p-ERK, ERK, p-JNK, JNK, p-p38MAPK and p38MAPK in heart were assayed by Western blot. The phosphorylated protein bands were standardized to total protein expression bands. Group I: control group received saline; Group II: MCT group received MCT(60 mg/kg); Group III: SIL Low group received MCT+SIL at 10 mg/kg/day; Group IV: SIL high group received MCT+SIL at 30 mg/kg/day; Group V: XMA High group received MCT+XMA at 62.9 mg/kg/day; Group VI: SIL(Low)+XMA(Low) group received SIL(10 mg/kg)+XMA at 125.8 mg/kg/day; Group VII: SIL(Low)+XMA(Medium) group received SIL(10 mg/kg)+XMA at 251.6 mg/kg/day; Group VIII: SIL(Low)+XMA(High) group received SIL(10 mg/kg)+XMA at 251.6 mg/kg/day. Data are presented as the mean ± SEM. *p < 0.05,**p < 0.01 vs. Group II; #p < 0.05, ##p < 0.01 vs. Group VIII.
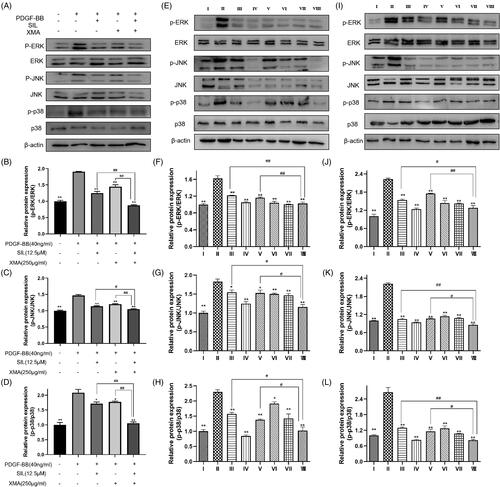
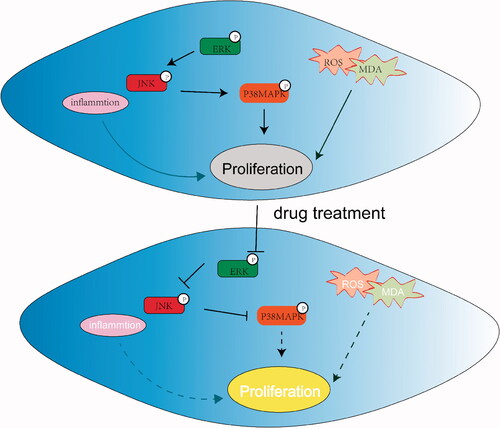
Figure 9. Graphical abstract of how XMA and SIL reduced pulmonary hypertension via the MAPK signalling pathway.