Figures & data
Figure 1. Effect of A. mongolica PET on the physiological and biochemical indices of the RF model. All values represent the mean ± SD. *p < 0.05, **p < 0.01.
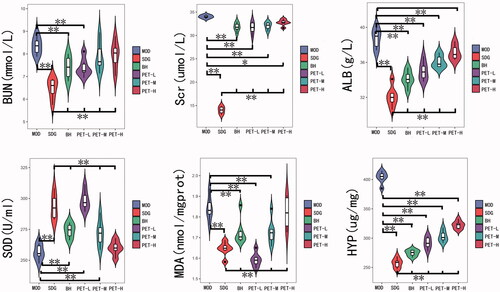
Table 1. Changes in content of A. mongolica PET on the physiological and biochemical indices of the RF model.
Figure 2. Pathological changes in renal tissue: (A) Representative images of HE staining (×200) and score; (B) Representative images of Masson staining (×200). Values represent the mean ± SD. *p < 0.05 and **p < 0.01 compared to the model group. #p < 0.05 and ##p < 0.01 compared to the sham group.
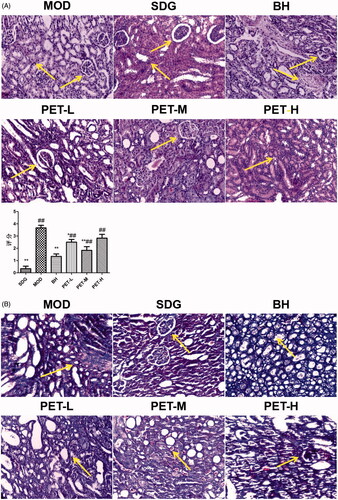
Figure 3. PCA score plot, PLS-DA score plot and validation plot of the PLS-DA model of SDG, MOD, BH, PET-L, PET-M and PET-H. (A) PCA score plot in positive ion mode; (B) PCA score plot in negative ion mode; (C) PLS-DA score plot in positive ion mode; (D) PLS-DA score plot in negative ion mode; (E) Validation plot of the PLS-DA model in positive ion mode; (F) Validation plot of the PLS-DA model in negative ion mode.
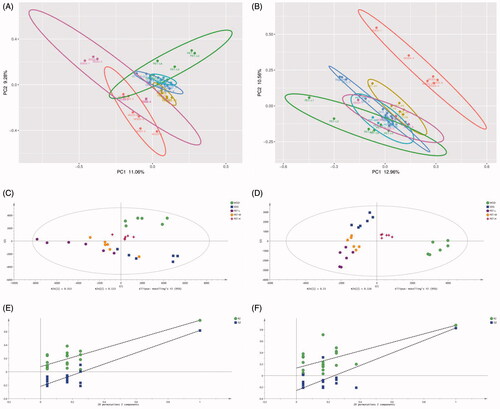
Figure 4. PLS-DA score plot, validation plot of the PLS-DA model and Volcano Plot map of SDG and MOD. (A) PLS-DA diagram in positive ion mode; (B) PLS-DA diagram in negative ion mode; (C) validation plot of the PLS-DA model in positive ion mode; (D) validation plot of the PLS-DA model in negative ion mode; (E) Volcano Plot map in positive ion mode; (F) Volcano Plot map in negative ion mode.
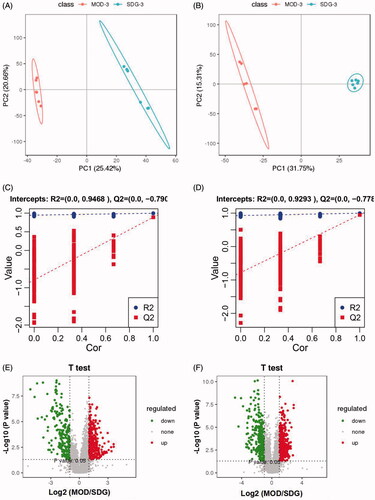
Figure 5. Analysis of the identified potential biomarkers. (A) Heat map of the differentially abundant metabolites in all groups. Rows – samples; columns – metabolites. The degree of colour saturation indicates the metabolite expression with green and red respectively indicating lowest and highest expression. (B) p-Value heat map of the differential abundance of metabolites in all groups. Rows – samples; columns – metabolites. The degree of colour saturation indicates intergroup differences in metabolite expression values with green and red respectively indicating non-significant and significant difference. (C) VENN diagram of PET-L, PET-M and PET-H biomarkers.
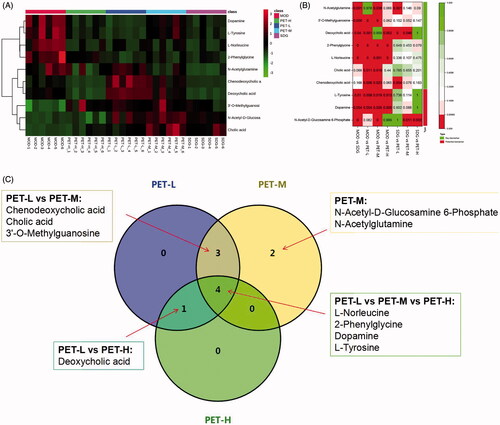
Table 2. Identification of potential biomarkers.
Figure 6. Analysis of related metabolic pathways and crucial biomarkers. (A) ROC analysis of 10 potential biomarkers; (B) Pearson rank correlation analysis between 10 crucial biomarkers and biochemical indicators. The red and blue colour gradients represent positive and negative correlation respectively. All values represent the mean ± SD. *p < 0.05, **p < 0.01; (C) Metabolic pathway analysis of crucial biomarkers. Summary of the altered metabolism pathways determined with MetPA and MetaboAnalyst 4.0. The size and colour of each circle indcate the pathway impact value and p-value respectively.
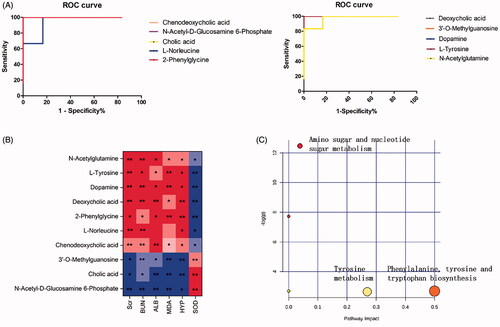
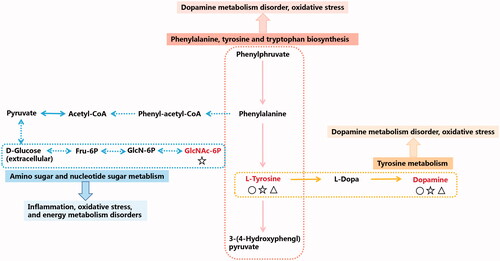
Figure 7. Network of the identified key biomarkers and pathways according to the KEGG pathway database. The metabolites coloured red represent the key biomarkers affecting the occurrence and development of renal fibrosis. The circles represent key biomarkers for PET-L callbacks. Pentacles represent a key biomarker of PET-M call-back. Triangles represent key biomarkers for PET-L callbacks.