Figures & data
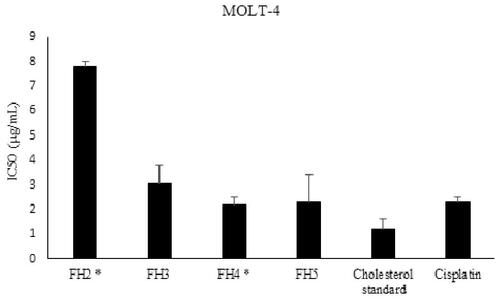
Figure 1. Structures of furodysin (1), furodysinin (2), and furoircin (3) isolated from Ircinia mutans.
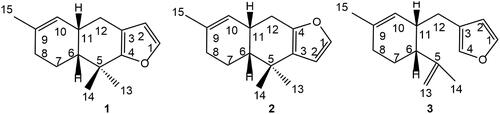
Figure 2. Structures of steroids identified from Ircinia mutans.
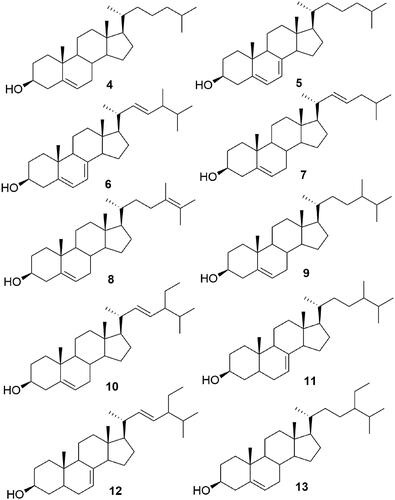
Figure 3. HPLC chromatograms of the subfraction FS6-10- F25-29 (steroids fraction) isolated from I. mutans (summer sample).
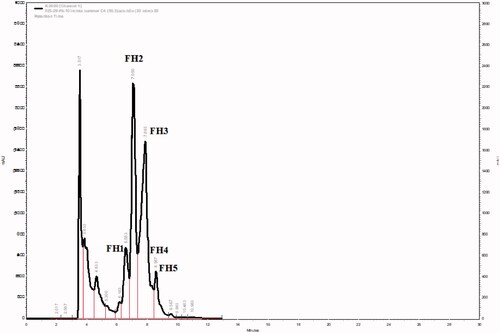
Figure 4. GC-MS chromatograms of FH2-FH5 of the HPLC semi-purified compounds 4–13 from FS6-10- F25-29 (steroids fraction) isolated from I. mutans (summer sample).
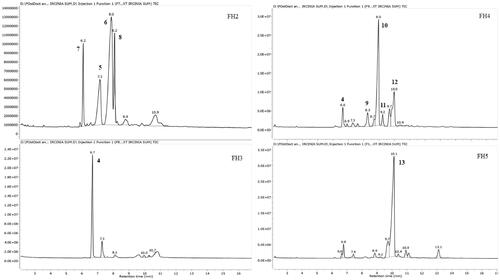
Table 1. 1H NMR (500 MHz) and 13C NMR (125 MHz) data of furoircin (3) in CDCl3.
Table 2. Sterol composition of I. mutans detected by GC-MS.
Table 3. Sterol composition of the HPLC Purified fractions from FS6-10- F25-29, characterised by GC-MS.
Figure 5. Cytotoxic activity of compounds isolated from I. mutans collected in winter (A) and summer (B) against three human cancer cell lines. Values are presented as mean ± S.E.M. of 3–5 experiments. *Compound 1w was not active against MOLT-4 and MCF-7 cell lines; IC50 > 100 µg/mL. **Compounds 4–13 were not tested against MCF-7 and HT-29 cell lines.
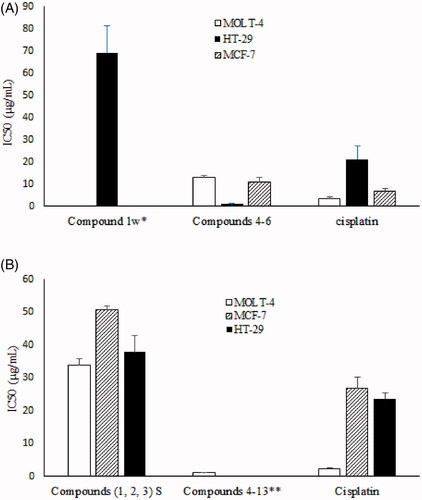
Figure 6. Cytotoxic activity of RP4-HPLC purified steroids isolated from I. mutans (summer sample) against human lymphoblastic leukaemia cell line. Values are presented as mean ± S.E.M. of 3-5 experiments. FH2: Compounds: 5, 6, 7 and 8, FH3: compound 4, FH4: compounds 4, 9, 10, 11 and 12; FH5: compound 13. Based on statistical analysis, cytotoxic activity of FH2 has significant difference with other fractions (p < 0.05) while FH4 and FH5 were not significantly different compared to that of cisplatin as a positive control (p > 0.05).