Figures & data
Table 1. The primer sequences for RT-qPCR.
Figure 1. (a) Intersection of ABR + SV targets, diabetes mellitus targets, and erectile dysfunction targets; (b) PPI network built by Cytoscape (3.7.1); (c) PPI network processed by Cytoscape (3.7.1) plug-in (cytohubba).
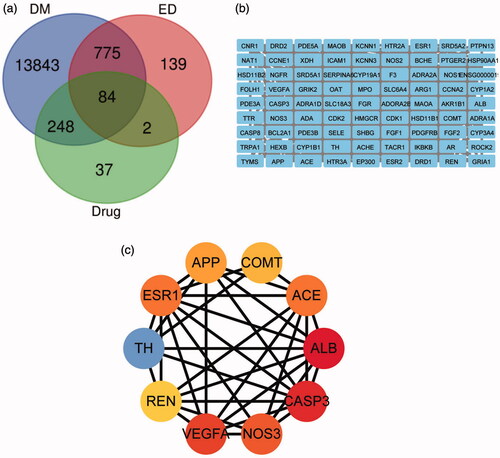
Figure 2. The network construction for herbal compound-target-disease.
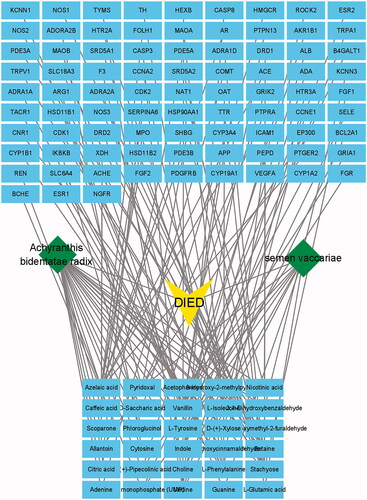
Table 2. Top 10 key targets.
Figure 3. Analyses of pathway enrichment using GO and KEGG databases.
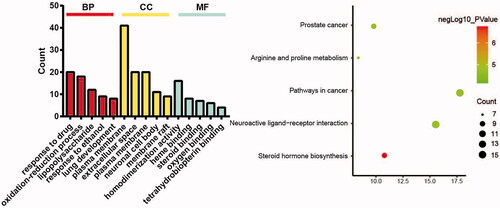
Table 3. Erectile times of rats in each group after drug intervention.
Figure 4. (a) The body weight in rats from the C, M, and T groups; (b) The blood glucose in rats from the C, M, and T groups; (c) The insulin in rats from the C, M, and T groups; (d. The glucagon in rats from the C, M, and T groups. Data are expressed as the mean ± SEM. Independent sample t-tests were employed for comparison between the two groups. Differences with p < 0.05 were considered statistically significant. #p< 0.05, the M group vs. the C group; *p < 0.05, the T group vs. the M group.
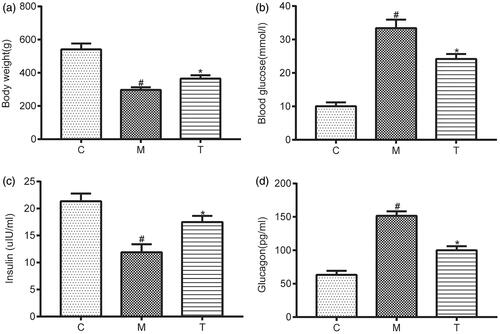
Figure 5 (a) H&E staining of the penile tissue of rats from the C, M, and T groups (×400). (i) In the C group: The trabeculae and blood sinuses were distributed evenly, and some red blood cells (RBCs) were in the sinus space, many smooth-muscle cells were in blood-containing sinus trabeculae. (Arrow ①②); (ii) In the M group: The number of blood-containing sinuses in the cavernous body was reduced significantly and its distribution was disordered, the density of endothelial cells and smooth muscle cells was decreased, and the number of collagen fibres was increased. (Arrow ③④); (iii) In the T group: the distribution of blood-containing sinuses was more regular than that in group M, the density of endothelial cells was increased, the number of collagen fibres was decreased, and RBCs were seen in some blood-containing sinuses. (Arrow ⑤⑥); (b) Ultrastructure of penile tissue of rats from the C, M, and T groups (×5000). (i) In the C group: the blood vessels of were normal, the morphology and structure of endothelial cells were basically normal, the nucleus was regular, the endothelial cells were closely connected, mitochondria and endoplasmic reticulum were observed in endothelial cells. (Arrow ①②); (ii) In the M group: Endothelial cells swelled, endothelial cell junction disappeared, endothelial cell mitochondria swelled and endoplasmic reticulum expanded. (Arrow ③④); (iii) In the T group: The blood vessels were normal, the morphology and structure of endothelial cells were basically normal, the endothelial cells were tightly connected, and mitochondria were seen in endothelial cells (Arrow ⑤⑥).
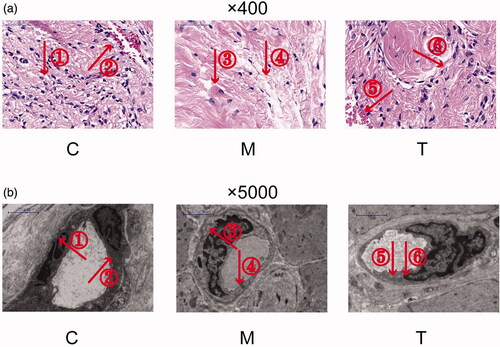
Figure 6. (a) Electrophoretogram of five proteins (CASP3, VEGFA, eNOS, ACE, and ALB) in rats from the C, M, and T groups. (b–f) The expression levels of five proteins (CASP3, VEGFA, eNOS, ACE, and ALB) in rats from the C, M, and T groups were determined using western blotting. Data are expressed as the mean ± SEM. Independent sample t-tests were employed for comparison between the two groups. Differences with p < 0.05 were considered statistically significant. #p < 0.05, the M group vs. the C group; *p < 0.05, the T group vs. the M group.
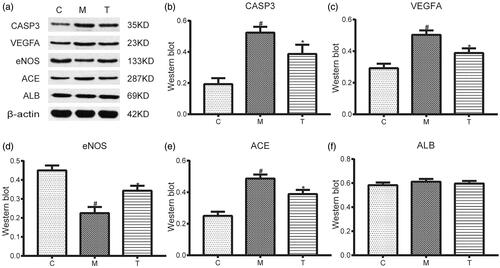
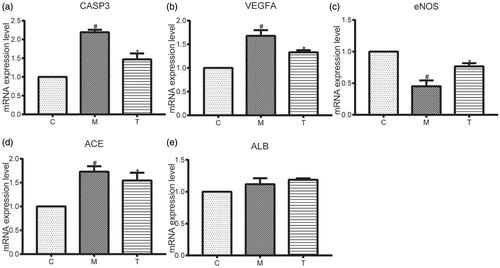
Figure 7. (a–e) The mRNA expression levels of five proteins (CASP3, VEGFA, eNOS, ACE, and ALB) in rats from the C, M, and T groups. determined using RT-qPCR. Data are expressed as the mean ± SEM. Independent sample t-tests were employed for comparison between the two groups. Differences with p < 0.05 were considered statistically significant. #p < 0.05, the M group vs. the C group; *p < 0.05, the T group vs. the M group.