Figures & data
Figure 1. Extract results. (a) Number of mesh sieve. (b) Added water quantity. (c) Heating temperature. (d) Extraction rate from different geographic areas.
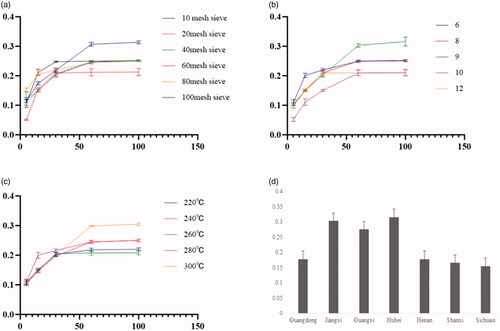
Figure 2. Fingerprints of volatile oil of C. minima from different producing areas (S1 Shanxi; S2 Hubei; S3 Jiangxi; S4 Guangxi; S5 Henan; S6 Sichuan; S7 Guangdong).
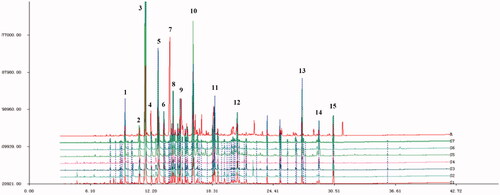
Figure 3. Cluster analysis diagram.
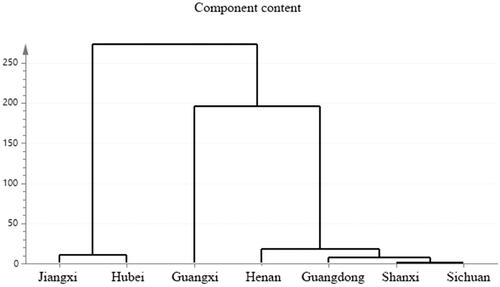
Table 1. Fingerprints of volatile oil of C. minima from different producing areas.
Figure 4. Component-target diagram.
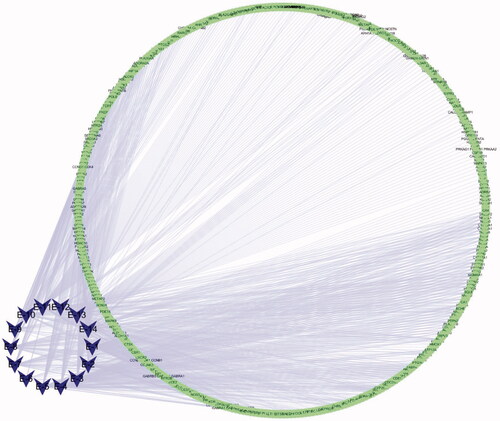
Table 2. Components and Pct Total in each production area.
Figure 5. (a) Composition target and disease target Venn diagram. (b) Ingredient-target-disease (The blue on the left represents the component, the green is the target of the component, the red on the right is the disease name, the purple is the disease target, and the orange in the middle represents the component target and the disease common target).
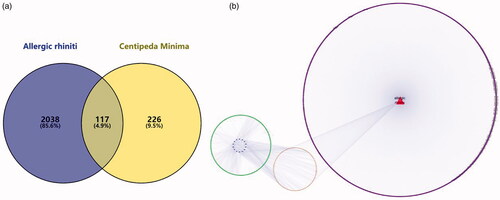
Figure 6. Protein interaction.
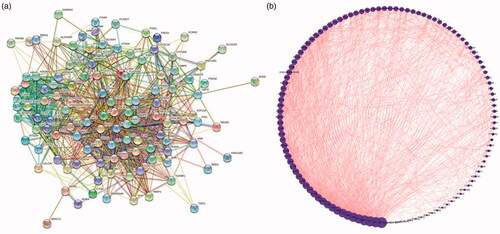
Figure 7. BP analysis. (a) top 20 pathways. (b) pathway relationship. (c) core pathway.
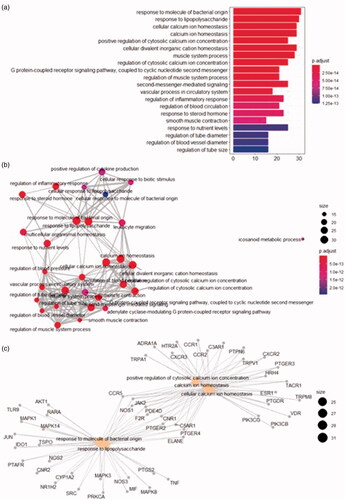
Figure 8. (a) CC analysis. (b) MF analysis. (c) KEGG pathway.
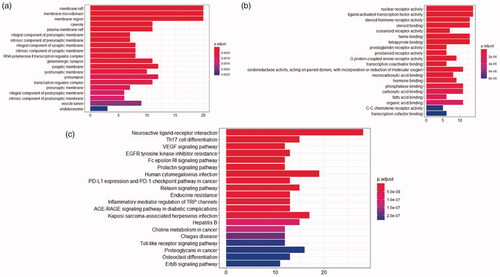
Figure 9. Molecular docking. (a) 5426 (Thalidomide) with TNF 2 D diagram. (b) 19725 (Copaene) with TNF 2 D diagram. (c) 5280581 (Dihomo-γ-linolenic acid) with PTGS2 2 D diagram. (d) 10408 (2-Pentadecanone, 6,10,14-trimethyl-) with PTGS2 2 D diagram. (e) 54675783 (Minocycline) with MAPK3 2 D diagram. (f) 19725 (Copaene) with MAPK3 2 D diagram.
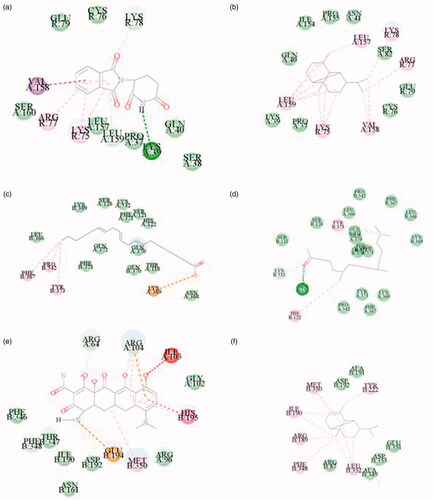
Table 3. Molecular docking scores.
Figure 10. Haematoxylin-eosin stain (a) (1)(2) is the blank group 4 × 10 and 10 × 10, (b) (1)(2) is the model group 4 × 10 and 10 × 10, (c) (1)(2) is the therapy group 4 × 10 and 10 × 10).
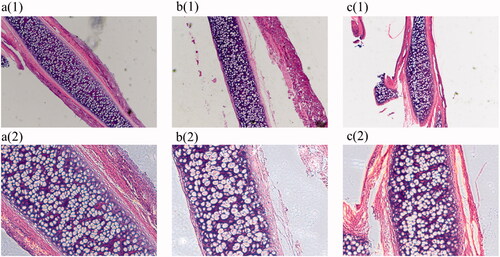
Figure 11. ELISA results. (a) TNF-α. (b) IgE. (c) IL-2. (d) IL-4 ####p < 0.0001, ###p < 0.001 versus blank group; **p < 0.01, ***p < 0.001 versus model group.
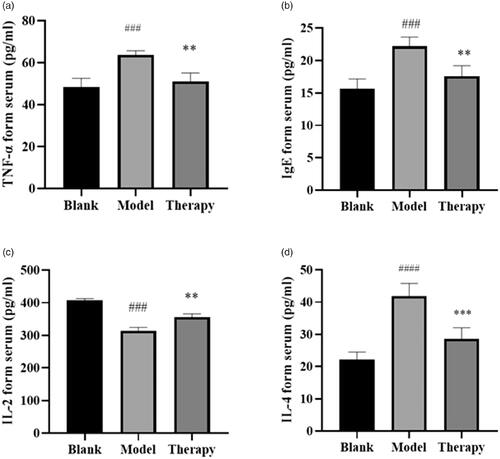
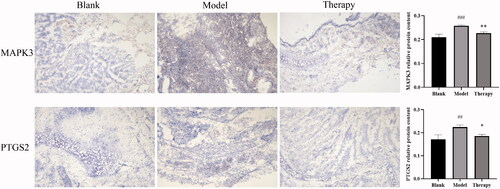
Figure 12. Immunohistochemistry ###p < 0.001, ##p < 0.01 versus blank group; *p < 0.05, **p < 0.01 versus model group.