Figures & data
Figure 1. Lappaol F (LAF) inhibited viability of human cancer cells. (A) Structure of LAF. (B-E). Human cancer cells (HeLa, MDA-MB-231, SW480 and PC3) were treated with LAF (0, 10, 25, 50 or 75 µmol/L) for 24, 48 or 72 h. Cell viability was assessed by sulforhodamine B assay. All data are expressed as the mean ± SD (n = 5). **p < 0.01, significantly different from the control without LAF treatment.IC50: half inhibitory concentration.
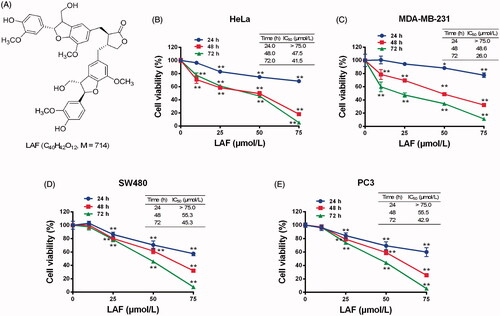
Figure 2. Lappaol F (LAF) promoted apoptosis in cancer cells. LAF (0, 25, 50 or 75 µmol/L) was incubated with cancer cells for 48 h. The rate of apoptosis was analysed by flow cytometry after annexin V-FITC/PI staining. (A) Representative plots of HeLa cells. (B) Representative plots of MDA-MB-231 cells. (C) Representative plots of SW480 cells. (D) Representative plots of PC3 cells. (E) Quantification of apoptosis (including early and late apoptotic cells). All data are expressed as the mean ± SD (n = 3). **p < 0.01, significantly different from the control without LAF treatment.
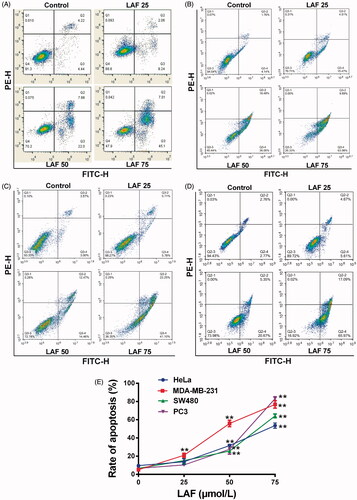
Figure 3. Patterns of mRNA level changes in the Hippo signalling pathway induced by Lappaol F (LAF). For transcriptome analysis, SW480 cells were treated with 50 µmol/L LAF for 12, 24 or 36 h. For quantitative RT-PCR, cancer cells (HeLa, MDA-MB-231, SW480 and PC3) were treated with 50 µmol/L LAF for 36 h. (A) Differentially expressed genes (fold change ≥ 2 and false discovery rate < 0.01) involved in the Hippo pathway. (B) YAP mRNA levels measured by quantitative RT-PCR. (C) 14-3-3σ mRNA levels measured by quantitative RT-PCR. All data are expressed as the mean ± SD (transcriptomic analysis, n = 3; quantitative RT-PCR, n = 6). **p < 0.01, significantly different from the control without LAF treatment. AREG: amphiregulin; Axin2: axis inhibition protein 2; Bcl-2: B cell lymphoma/leukemia-2; BIRC5: survivin/baculoviral IAP repeat containing 5; c-Myc: cellular myelocytomatosis oncogene; GLI2: glioma-associated oncogene family zinc finger 2; YAP: Yes-associated protein.
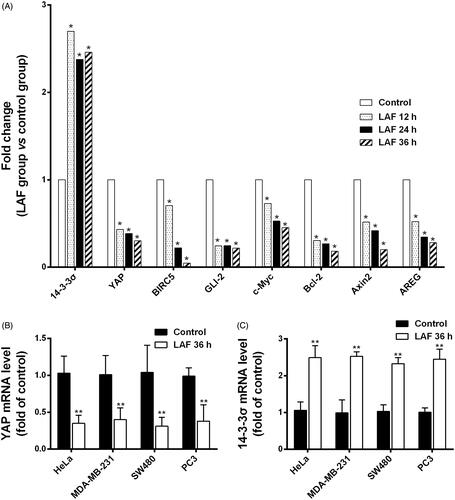
Figure 4. Lappaol F (LAF) downregulated the expression of YAP and its target genes in diverse cancer cell lines. The cells were exposed to LAF at different concentrations for 48 h (left side) or at 50 µmol/L LAF for different durations (right side). VP, a known YAP inhibitor, was added (1 µmol/L) as a positive control. Protein levels were determined by western blotting. (A) HeLa cells. (B) MDA-MB-231 cells. (C) SW480 cells. (D) PC3 cells. All data are expressed as the mean ± SD (n = 3). *p < 0.05, **p < 0.01, significantly different from the control without LAF treatment at the corresponding time points. Bcl-2: B cell lymphoma/leukemia-2; BIRC5: survivin/baculoviral IAP repeat containing 5; c-Myc: cellular myelocytomatosis oncogene; VP: verteporfin; YAP: Yes-associated protein; VP + LAF: LAF (50 µmol/L) combined with VP (1 µmol/L).
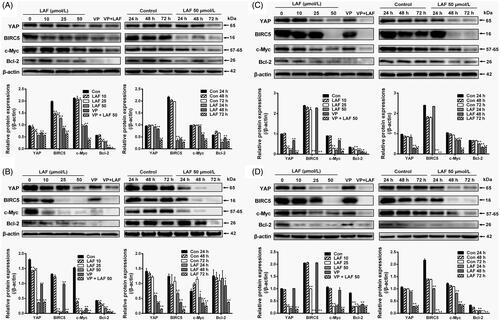
Figure 5. Lappaol F (LAF) decreased the nuclear accumulation of YAP. (A) Cellular location of YAP (green color) in HeLa cells treated with LAF (50 µmol/L), VP (1 µmol/L) or EGF (20 ng/mL) alone or simultaneously for 48 h. YAP was detected by immunofluorescence staining, while the nuclei (blue color) were detected by staining with 4,6-diamino-2-phenyl indole. Pictures at the right side (scale bars: 10,000 nm) are an enlargement of yellow frames in the pictures at the left side (scale bars: 20,000 nm). (B) Viability of HeLa cells treated with LAF (0, 10, 25, 50 or 75 µmol/L) alone or simultaneously with VP (1 µmol/L) or EGF (20 ng/mL) for 48 h measured by sulforhodamine B assay. All data are expressed as the mean ± SD (n = 6). *p < 0.05, **p < 0.01, significantly different from the control group. DMSO: dimethyl sulfoxide; EGF: epidermal growth factor; VP: verteporfin; YAP: Yes-associated protein.
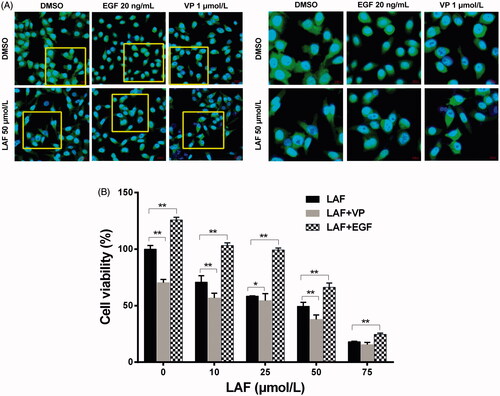
Figure 6. Lappaol F (LAF) inhibited YAP by increasing 14-3-3σ levels. (A) HeLa, MDA-MB-231, SW480 and PC3 cells were treated with LAF at different concentrations for 48 h (left side), or at 50 µmol/L LAF for different durations (right side). Western blotting was performed to evaluate the levels of 14-3-3σ. (B-D), HeLa cells were transfected with 14-3-3σ siRNA followed by LAF (50 µmol/L) treatment for 24 h. (B) The protein levels of 14-3-3σ and YAP were measured by western blotting. (C) Cell viabilities were measured by sulforhodamine B assay. (D) The expression and location of 14-3-3σ (red color) and YAP (green color) were observed by immunofluorescence staining. Nuclei (blue color) were stained with 4,6-diamino-2-phenyl indole. Scale bars represent 20,000 nm. All data are expressed as the mean ± SD (western blotting and immunofluorescence, n = 3; cell viability, n = 6). *p < 0.05, **p < 0.01, significantly different from the control siRNA group. DMSO: dimethyl sulfoxide; siRNA: small interfering RNA.
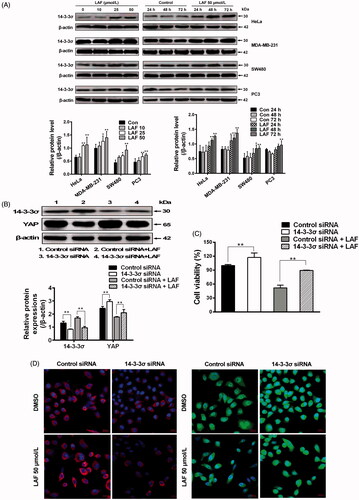
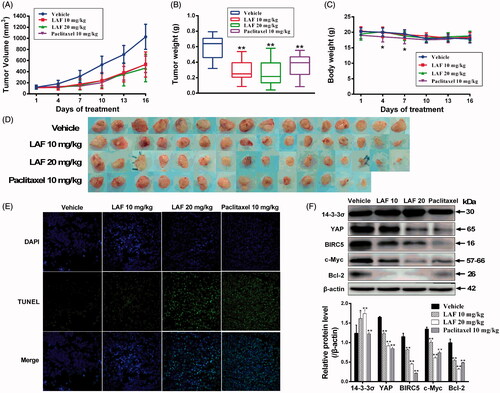
Figure 7. Lappaol F (LAF) suppressed the growth of tumour xenografts in nude mice. SW480 colon cancer cells were subcutaneously injected into the left and right back regions of nude mice to induce tumours. Subsequently, the tumour-bearing mice were intravenously administrated with LAF (n = 8) or vehicle (n = 8) for 15 consecutive days, or paclitaxel every other day (n = 7, one mouse in this group died on the 8th day of administration). (A) Tumour volumes. (B) Tumour weight. (C) Body weight. (D) Tumours. (E) The apoptosis of tumours was determined using TUNEL (magnification, × 400). (F) Expression levels of proteins in tumour tissues were detected by western blotting. All data are expressed as the mean ± SD. *p < 0.05, **p < 0.01, significantly different from the vehicle group. Bcl-2: B cell lymphoma/leukemia-2; BIRC5: survivin/baculoviral IAP repeat containing 5; c-Myc: cellular myelocytomatosis oncogene; DAPI: 4,6-diamino-2-phenyl indole; TUNEL: terminal deoxynucleotidyl transferase–mediated dUTP nick end labelling; YAP: Yes-associated protein.