
Figures & data
Figure 1. Chemical structures and product ion mass spectra of GRg1 (A), GRe (B), GRb1 (C), GRd (D), GRg5 (E), GRk1 (F) and NGR1 (G).
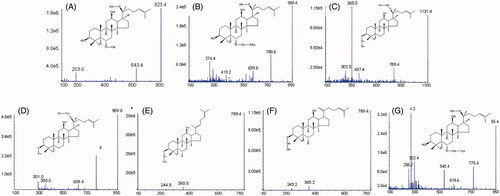
Figure 2. Representative MRM chromatograms of GRb1 (1), GRe (2), GRd (3), NGR1 (4), GRg1 (5), GRg5 (6), GRk1 (7) and theophylline (I.S., 8) in rat plasma: (A) blank rat plasma; (B) blank rat plasma spiked with standard compounds and IS; (C) plasma samples after oral administration of Panax notoginseng aqueous extract.
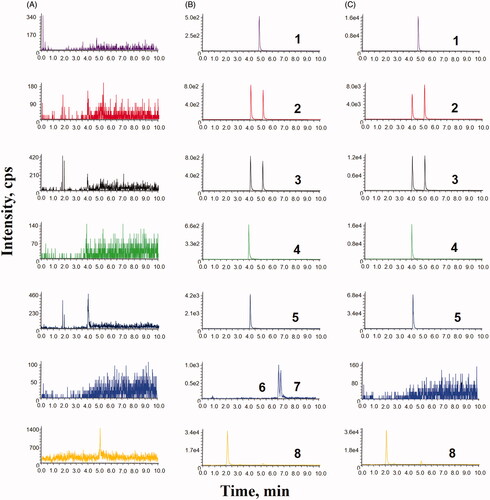
Table 1. Accuracy and precision of seven compounds from QC samples in rat plasma (n = 3 d, 6 replicates per day).
Table 2. Matrix effects and extraction recoveries of seven compounds in rat plasma (n = 5).
Table 3. Stability data of seven compounds and IS in rat plasma under various storage conditions (n = 3).
Figure 3. Saponin content in steaming Panax notoginseng root. The label on the left was for GRb1, GRe, GRd, NGR1 and GRg1 and the label on the right was for GRg5 and GRk1.
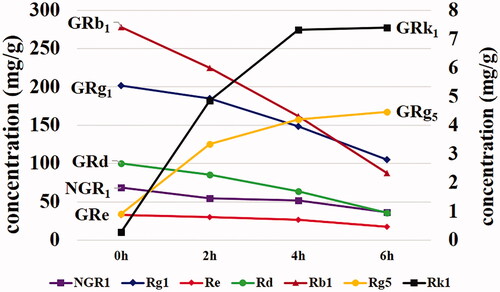
Figure 4. Mean plasma concentration–time profiles of NGR1 (A), GRb1 (B), GRg1 (C), GRd (D) and GRe (E) in the Sprague–Dawley rat after oral administration the extracts of Panax notoginseng at 5 mL/kg. Each point represents the means ± SD.
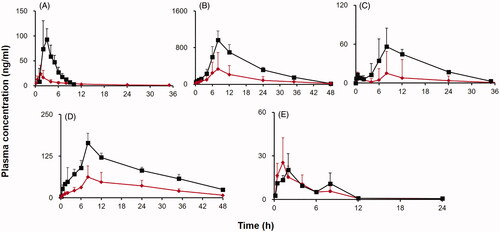
Table 4. Pharmacokinetic parameters for GRg1, GRe, NGR1, GRd and GRb1 in male SD rats following oral gavage of raw and steam-processed Panax notoginseng aqueous extracts (n = 6, mean ± SD).