Figures & data
Figure 1. High-performance liquid chromatography (HPLC) results for the methanolic extract of Angelica gigas root (AGmex) and the nodakenin and decursin standards. A, HPLC chromatogram of the standards and their chemical structures. B, HPLC chromatogram of AGmex. C, Mobile phase gradient (mobile phase A, acetonitrile; mobile phase B, water). Conditions used: HPLC, Shimadzu system (Shimadzu, Kyoto, Japan); column, YMC-Triart C18; wavelength, 330 nm; column temperature, 35 °C; flow rate, 1 mL/min; injection volume, 10 μL.
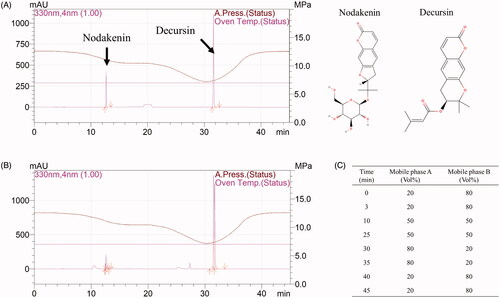
Figure 2. Experimental schedule of the 2 h transient middle cerebral artery occlusion (tMCAO) model. The mice were acclimated for 1 week in our animal facility before study commencement. Pre-treatment (Pre-Tx.) and post-treatment (Post-Tx.) studies were carried out to determine the timing of AGmex administration. TTC; 2,3,5-triphenyl-tetrazolium chloride; EB; Evans blue.
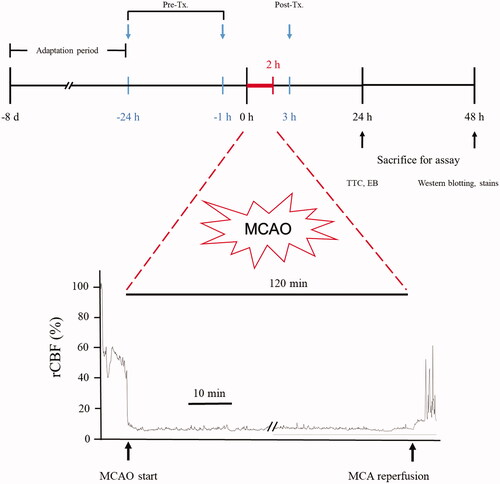
Figure 3. Infarct volumes, edoema areas, and neurologic deficit scores (NDS). (A) Representative photographs of TTC-stained brain coronal slices (1 mm) showing infarct areas 24 h after tMCAO (upper column) and total infarct volumes (lower column). (B) Quantitative analysis of the total edoema area. (C) Neurologic deficit score (NDS). S = single AGmex treatment at 300, 1000 or 3000 mg/kg bw p.o. and T = AGmex treatment for two consecutive days at 300, 1000 or 3000 mg/kg bw/d p.o.; ND, nimodipine (positive control), which was administered once or twice at 60 mg/kg at 1 h or 1 h and 24 h after MCAO, respectively. Results are presented as means ± SDs (n = 3). ##p < 0.01, ###p < 0.001 vs. the sham-operated group; *p < 0.05, **p < 0.01, ***p < 0.001 vs. the MCAO group.
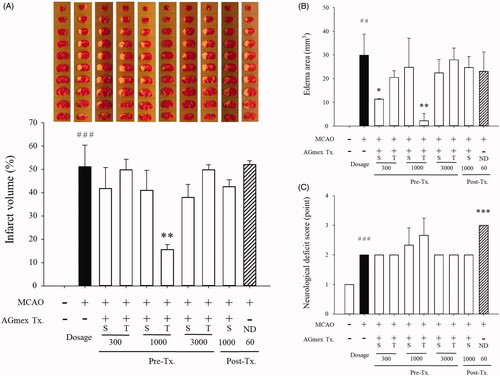
Figure 4. Effects of AGmex on blood-brain barrier (BBB) permeability and the localisation of AQP4 (aquaporin 4) protein in MCAO-induced mouse brains. (A) Representative images of EB extravasation in whole brain and coronal sections (upper column), and quantification of EB leakage in the ipsilateral (left) hemispheres and contralateral (right) hemispheres (lower column, n = 3). (B), Immunohistochemical (IHC) staining of AQP4 protein in the cerebral cortex (black arrows indicate negativity and red arrows positivity). Scale bars: 5 µm. Results are presented as means ± SDs (n = 3). ###p < 0.001 vs. the sham-operated group; *p < 0.05 and ***p < 0.001 vs. the MCAO group.
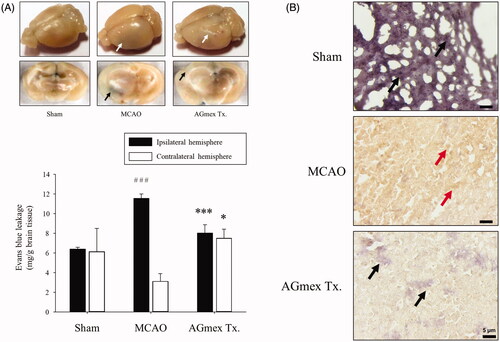
Figure 5. Neuroprotective effects of double pre-treatment (at 1 h and 24 h pre-MCAO) with AGmex at 1000 mg/kg on MCAO-induced cell death. (A) Representative photomicrographs of Nissl-stained neurons in the subcortical area (upper images) ischaemic ipsilateral hemisphere and results of quantitative analysis showing changes in neuron numbers following tMCAO induction and pre-treatment with AGmex (lower graph). (B) Representative photomicrographs of haematoxylin and eosin (H&E)-stained neurons (upper images) and results of quantitative analysis showing changes in neuron numbers (lower graph). Black arrows indicate intact neurons with normal morphology, and red arrows indicate neurons showing apoptotic changes and aberrant morphologies. Scale bars: 20 µm. #p < 0.05, ##p < 0.01 vs. sham controls; *p < 0.05, **p < 0.01 vs. the MCAO group.
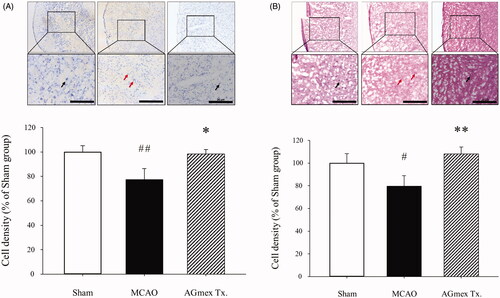
Figure 6. Effects of double pre-treatment (at 1 h and 24 h pre-MCAO) with AGmex at 1000 mg/kg on MCAO-induced cell death. (A) Representative images of TUNEL and PI double-stained cerebral cortex regions showing MCAO-induced apoptosis; white arrows indicate neurons showing apoptotic changes (scale bars: 50 µm). (B) Representative images of IHC staining of MCAO-induced changes in mTOR (mammalian target of rapamycin) protein expression in the cerebral subcortical regions of tMCAO-induced mice; red arrows indicate mTOR positivity, and black arrows indicate mTOR negativity (scale bars: 20 µm).
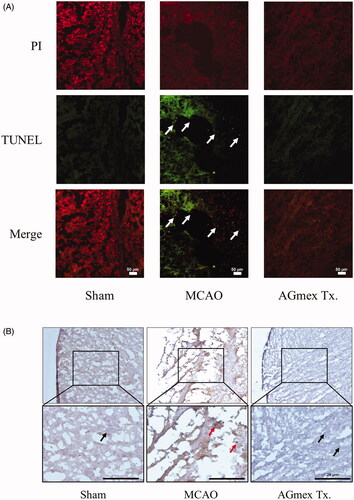
Figure 7. Effects of double pre-treatment (at 1 h and 24 h pre-MCAO) with AGmex at 1000 mg/kg on the proteins expressed in MCAO-induced mouse brains. (A) Representative western blot image of the expression of Bcl-2, Bax, p-PI3K, PI3K, p-AKT, AKT, p-ERK, ERK, p-JNK, JNK, p-p38, p38, SIRT1, MnSOD, and β-actin in MCAO-treated mouse brain. B-I, ratios of the expression levels of signalling proteins: (B) Bcl-2/Bax; C, p-PI3K/PI3K; D, p-AKT/AKT; E, p-ERK/ERK; F, p-JNK/JNK; G, p-p38/p38; H, SIRT1/β-actin; and I, MnSOD/β-actin. Results are presented as means ± SDs (n = 3). #p < 0.05, ###p < 0.001 vs. sham-operated controls; *p < 0.05, **p < 0.01 vs. the MCAO group.
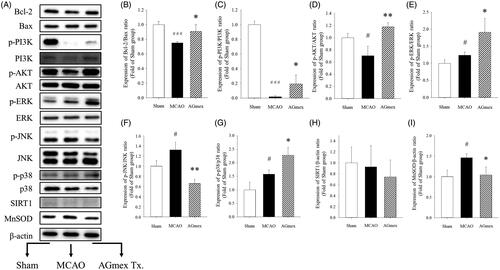
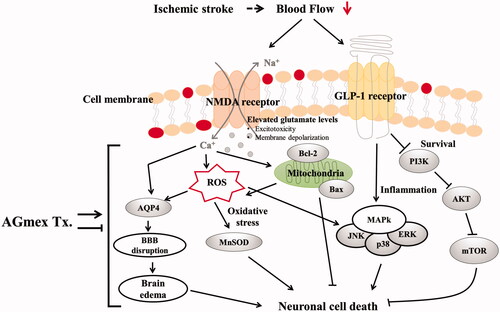
Figure 8. Schematic view of the suggested cerebral damage pathways and the neuroprotective mechanism of AGmex. AGmex ameliorated mitochondrial function and MAPK signalling pathways in the neurons exposed to ischaemia, and the neuroprotective effects of AGmex were found to mainly involve anti-edoema and anti-apoptotic pathways.