Figures & data
Table 1. Constituents of HXZQ-OL.
Table 2. Forward and reverse primers sequences of genes.
Figure 1. Effects of HXZQ-OL on degranulation (A) and cell viability (B) in IgE/Ag-mediated RBL-2H3 cells. The data were expressed as the mean ± SD values of five independent experiments. *p < 0.05 and **p < 0.01.
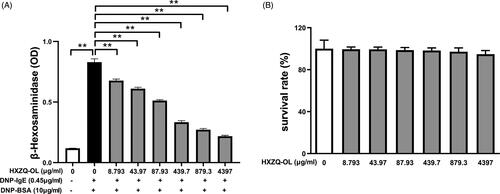
Figure 2. HXZQ-OL inhibited the release of proinflammatory mediators: IL-4 (A), TNF-α (B), LTC4 (C) and PGD2 (D) in IgE/Ag-mediated RBL-2H3 cells. IgE-sensitized RBL-2H3 cells were incubated with HXZQ-OL (43.97, 439.7 and 4397 μg/mL) for 30 min, followed by DNP-BSA challenge for 4 h. The amounts of IL-4, TNF-α, LTC4 and PGD2 were determined using ELISA kits following the manufacturers’ instructions. The data were expressed as the mean ± SD values of three independent experiments. *p < 0.05 and **p < 0.01.
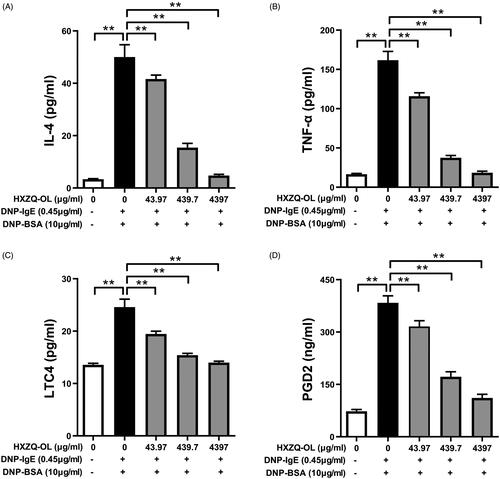
Figure 3. HXZQ-OL reduced the levels of IL-4 mRNA (A) and TNF-α mRNA (B) in IgE/Ag-mediated RBL-2H3 cells. IgE-sensitized RBL-2H3 cells were incubated with HXZQ-OL (43.97, 439.7 and 4397 μg/mL) for 30 min, followed by DNP-BSA challenge for 4 h. The gene expression of IL-4 and TNF-α were measured by RT-qPCR. The data were expressed as the mean ± SD values of three independent experiments. *p < 0.05 and **p < 0.01.
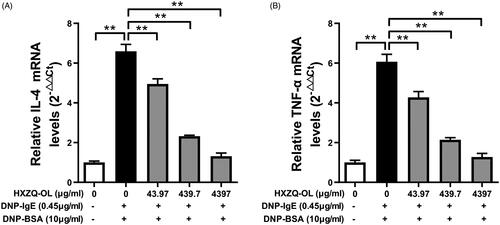
Figure 4. HXZQ-OL inhibited the intracellular Ca2+ concentration in IgE/Ag-mediated RBL-2H3 cells. IgE-sensitized RBL-2H3 cells were incubated with HXZQ-OL for 30 min, followed by DNP-BSA challenge for 10 min. The intracellular Ca2+ concentration was determined using flow cytometry with Fluo 3/AM probe. The data were expressed as the mean ± SD values of three independent experiments. *p < 0.05 and **p < 0.01.
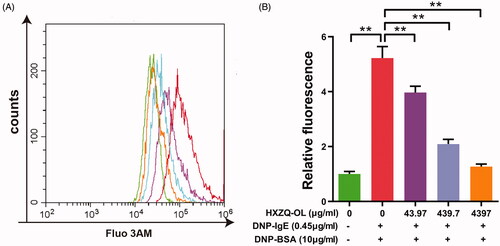
Figure 5. Inhibitory effects of HXZQ-OL on the phosphorylation of FcεRI-induced degranulation signalling cascades (A, B, C) and MAPKs (D) in IgE/Ag-mediated RBL-2H3 cells. IgE-sensitized RBL-2H3 cells were incubated with HXZQ-OL for 30 min, followed by DNP-BSA challenge for 10 min. The expression levels of p-Fyn, p-Lyn, p-Syk, p-PLCγ1, p-PLCγ2, p-PKCδ, p-Gabs, p-PI3K, p-Akt, p-ERK1/2, p-p38 and p-JNK1/2 were normalized to total proteins, respectively. The data were expressed as the mean ± SD values of three independent experiments. *p < 0.05 and **p < 0.01.
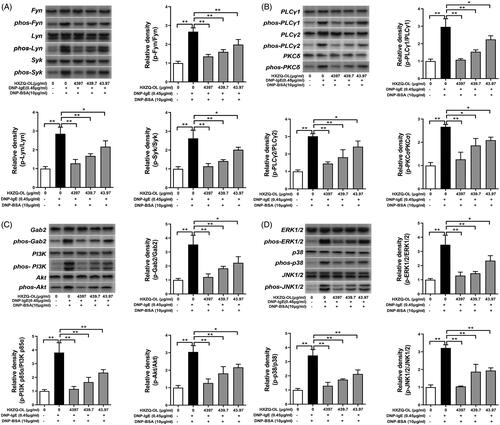
Figure 6. Inhibitory effects of HXZQ-OL on the activations of PI3K/NF-κB (A) and eicosanoid cascades (B) in IgE/Ag-mediated RBL-2H3 cells. IgE-sensitized RBL-2H3 cells were preincubated with HXZQ-OL for 30 min, followed by DNP-BSA challenge for 4 h. P-IKKα/β and p-cPLA2 were normalized to total proteins, respectively. The endogenous reference protein used for p-IκB, IκB, 5-LO, COX-2 and cytosolic NF-κB p65 was β-actin whereas for nuclear NF-κB p65 was Lamin B. The data were expressed as the mean ± SD values of three independent experiments. *p < 0.05 and **p < 0.01.
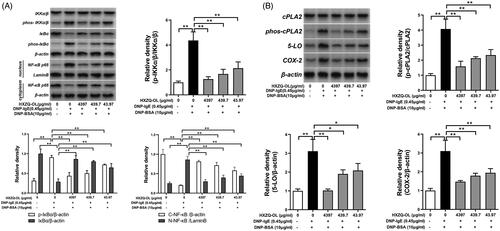
Figure 7. HXZQ-OL inhibited IgE/Ag-mediated PCA in mice. (A) Experimental schedule. (B) Evans blue exudation. BALB/c mice were orally administrated with HXZQ-OL (263.8, 527.6 and 1055 mg/kg/d) or dexamethasone (DEX, 5 mg/kg/d) for seven consecutive days. One hour after the administration with HXZQ-OL, the ears of mice were intradermally injected with 100 ng anti-DNP-IgE on the sixth day. Twenty-four hour after ears sensitisation with IgE, mice were intravenously injected with 100 µg DNP-BSA containing 0.5% Evans blue for 30 min. After 30 min, Evans blue was extracted, and the absorbance was measured at 630 nm. The data were expressed as the mean ± SD values of five independent experiments. *p < 0.05 and **p < 0.01.
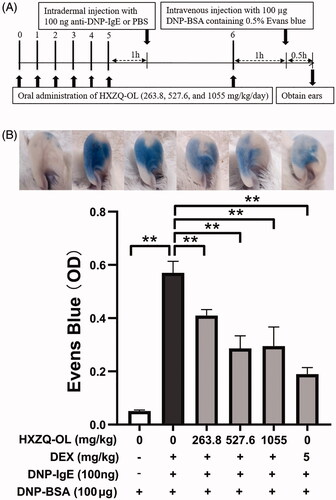
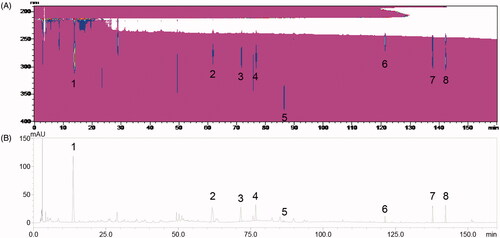
Figure 8. HPLC chromatograms of HXZQ-OL (A) Contour plot (190–400 nm) (B) 276 nm. 5-HMF (1), liquiritin (2), narirutin (3), hesperidin (4), isoliquiritin (5), glycyrrhizin (6), honokiol (7) and magnolol (8) were identified. HPLC analysis was described in the materials and methods.