Figures & data
Figure 1. Isolation and identification of Se-SP. (A) Culture of Se-enriched S. platensis. Se-enriched S. platensis was cultured with Zarrouk medium (pH 9.0) in a 1000 mL Erlenmeyer flask. Morphology of Se-enriched S. platensis was detected by light microscope and fluorescence microscope. (B) Spectroscopic feature of Se-SP. The fluorescence spectrum of Se-SP crude was examined by fluorescence microreader. (C) Intracellular uptake of Se-PC. MOVAS cells were treated with 20 μg/mL Se-SP for 1–48 h, and the intracellular uptake of Se-SP was examined by ICP-AES method. All data was shown as mean ± standard deviation (SD) of three different experiments. Bars with ‘*’ or ‘**’ represent p < 0.05 and p < 0.01, respectively.
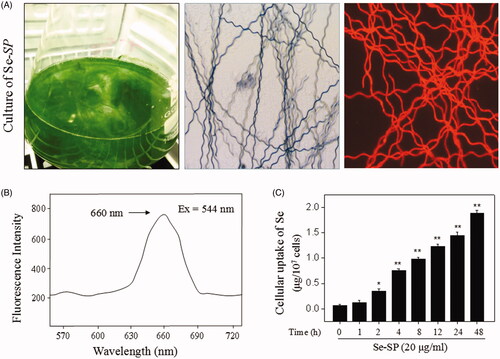
Figure 2. Se-SP inhibits OGD-induced neuronal toxicity. (A) Time-dependent cytotoxicity of OGD treatment on primary neurons. Primary neurons were cultured for 1–12 h under OGD condition. (B) Cytotoxicity of Se-SP or SP towards primary neurons. Primary neurons were treated with 5–20 μg/mL Se-SP or SP for 48 h. (C) Se-SP inhibits OGD-induced neuronal toxicity. Primary neurons were treated with 5 and 10 μg/mL Se-SP (or SP) or/and co-treated with OGD treatment for 6 h. Neural viability was determined using MTT assay. (D) Neuronal morphology. Morphology of primary neurons with or without tubulin staining was determined by phase contrast and fluorescence microscope (magnification, 200×). Bars with ‘*’ or ‘**’ represents p < 0.05 and p < 0.01, respectively. Bar with different letters means the statistic difference at p < 0.05.
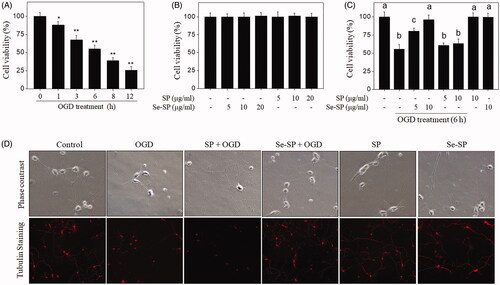
Figure 3. Se-SP attenuates OGD-induced neurons apoptosis. (A) Caspases activation induced by OGD. (B) Caspases expression induced by OGD. (C) TUNEL-DAPI staining. Nuclear condensation and DNA fragmentation were examined by TUNEL-DAPI double staining (magnification, ×200). (D) Se-SP attenuated OGD-induced caspases activation. Details of the experiments followed the methods part. Caspases activity and expression were measured by microplate reader and western blotting, respectively. Neurons apoptosis (TUNEL-positive) was determined by a fluorescence microscope. Bars with ‘*’ or ‘**’ suggests p < 0.05 and p < 0.01, respectively.
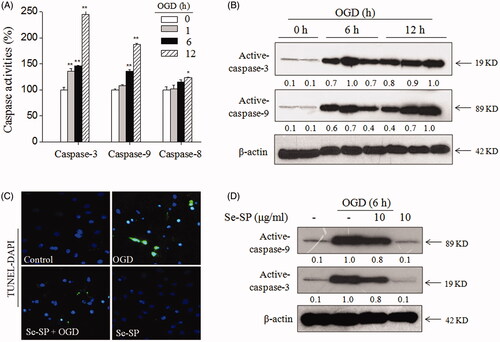
Figure 4. Se-SP improves OGD-induced mitochondrial dysfunction by regulating Bcl-2 family. (A) Se-SP prevented OGD-caused mitochondrial membrane potential dissipation. mitochondrial membrane potential (MPP) was detected by JC-1 probe as described in the method section. (B) Time-dependent dysfunction of Bcl-2 family in OGD-treated neurons. (C) Se-SP normalized Bcl-2 family proteins expression in OGD-treated neurons. Bcl-2 family expression was detected by western blotting.
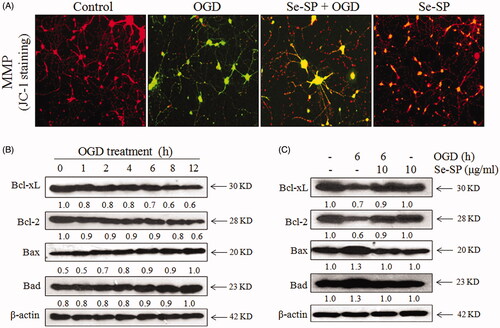
Figure 5. Se-SP suppresses OGD-induced oxidative damage by inhibiting ROS accumulation. (A) Se-SP prevented OGD-induced ROS accumulation. Primary neurons were loaded with DCFH-DA or Mito-SOX before treatment for detection of ROS and superoxide anion, respectively. Images were observed by a fluorescence microscope. (B) Time-dependent DNA damage in OGD-treated neurons. (C) Se-SP suppressed OGD-induced DNA damage. Details of the experiments followed the methods part. Protein expression was detected by western blotting method.
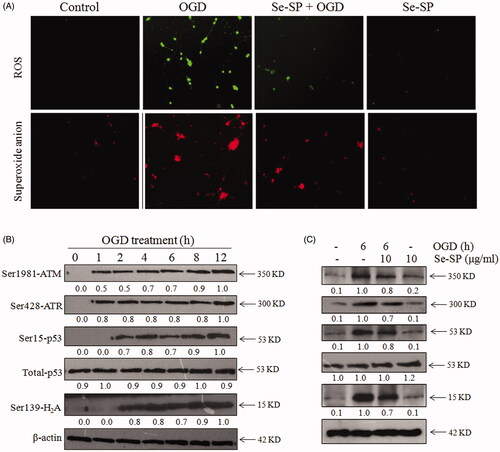
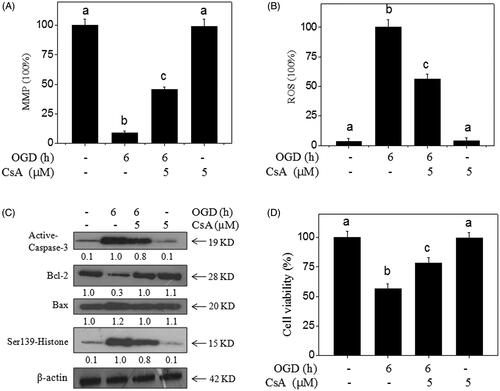
Figure 6. MPTP inhibition blocks OGD-induced neural toxicity. CsA (MPTP inhibitor) improved the MPP (A) and inhibited ROS generation (B) in OGD-treated neurons. Primary neurons were pre-treated with 5 μM CsA for 30 min and co-treated with OGD. (C) Effects of CsA on protein expression in OGD-treated neurons. Protein expression was detected by western blotting method. (D) MPTP inhibition blocks OGD-induced neural toxicity. Neural viability was examined by MTT assay. Bar with different letters means the statistic difference at p < 0.05.