
Figures & data
Figure 1. Plasma concentration curve of R-WF in control and treatment groups; closed cycle: control group-Pulvis Gum Arabicum (2% PGA); closed rectangle: FZ group – Fluconazole at a dose of 6 mg/kg BW. Closed diamond: CX-1 – CX extract at a dose of 6 mg/kg BW; closed triangle: CX-2 is CX extract at a dose of 30 mg/kg BW.
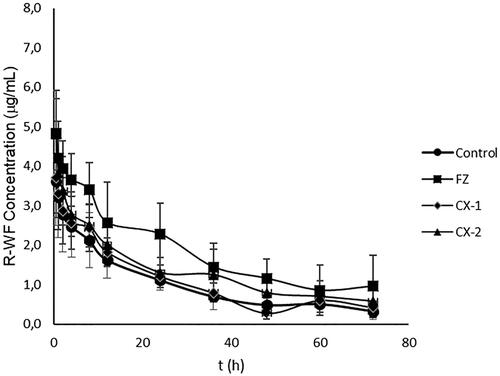
Figure 2. Plasma concentration curve of S-WF in control and treatment groups; closed cycle: control group-Pulvis Gum Arabicum (2% PGA); closed rectangle: FZ group – Fluconazole at a dose of 6 mg/kg BW. Closed diamond: CX-1 – CX extract at a dose of 6 mg/kg BW; closed triangle: CX-2 is CX extract at a dose of 30 mg/kg BW.
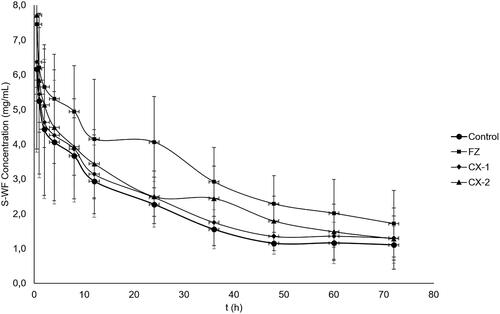
Table 1. The concentration of R- and S-WF in rats after concomitant administration with CX extract.
Table 2. Pharmacokinetic parameters of R- and S-WF in rats after administration of CX extract concomitantly.
Figure 3. Plasma concentration curve of R-WF in control and treatment groups with multiple-dose administration; closed cycle: control group, Pulvis Gum Arabicum (2% PGA); closed rectangle: FZ group, Fluconazole at a dose of 6 mg/kg BW. Closed diamond: CX-1, CX extract at a dose of 6 mg/kg BW; closed triangle: CX-2, CX extract at a dose of 30 mg/kg BW. SD bar is not displayed in this figure.
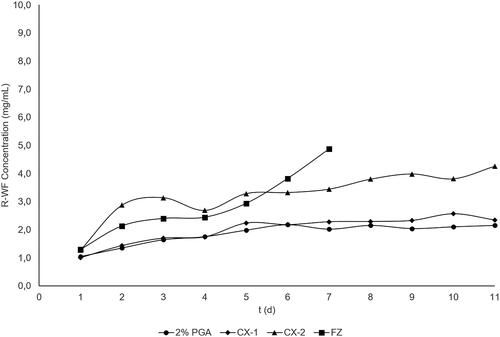
Figure 4. Plasma concentration curve of S-WF in control and treatment groups with multiple-dose administration; closed cycle: control group, Pulvis Gum Arabicum (2% PGA); closed rectangle: FZ group, Fluconazole at a dose of 6 mg/kg BW. Closed diamond: CX-1, CX extract at a dose of 6 mg/kg BW; closed triangle: CX-2, CX extract at a dose of 30 mg/kg BW. SD bar is not displayed in this figure.
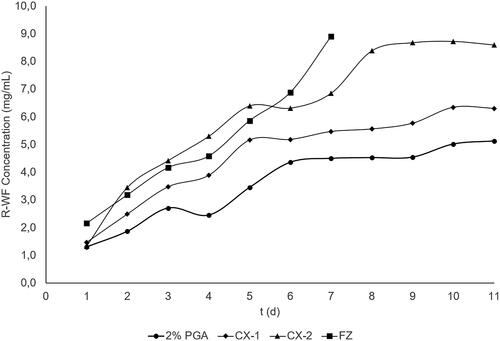
Table 3. The concentration of R- and S-WF in the four groups of rats from day of 1–11 using multiple-dose study.
Table 4. The increase in concentration level (ICL) of R- and S-WF from the 7th to 9th day in all groups of rats after CX extract administering concomitantly in the multiple-dose study.