Figures & data
Figure 1. The HPLC chromatographic profile of ganoderic acids in the extract of G. sinensis. (A) Reference substance. (B) Sample of the extract of G. sinensis. (1) Ganoderenic acid B; (2) ganoderic acid A; (3) ganoderenic acid D; (4) ganoderic acid D; (5) lucidenic acid D; (6) ganolucidate F.
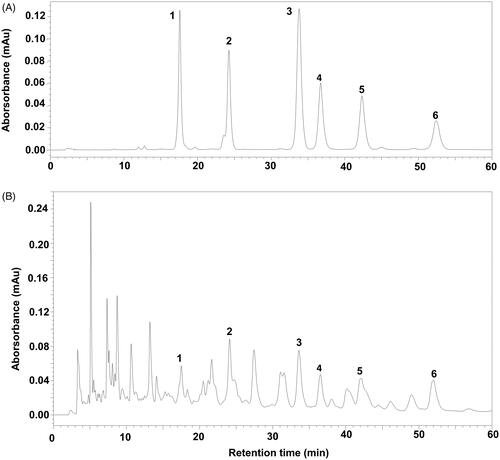
Table 1. Retention time reproducibility, regression equations, correlation coefficients (R2) and linearity ranges of constituents of the extract of G. sinensis.
Table 2. Precision, reproducibility, stability and recovery of constituents of the extract of G. sinensis (n = 6).
Figure 2. GSE treatment results in decreased cell growth and extensive cytoplasmic vacuolation in HepG2 cells. (A) The inhibitory effects of GSE on cell growth in HepG2 cells or normal liver epithelial cells HL-7702. Cells were treated with the indicated concentrations of GSE for 24 h, cumulative viable cells were measured by the Alamar Blue assay. Data are presented as the means ± SEM of three independent experiments. (B) Morphological alterations of HepG2 cells after treatment with GSE for 24 h by light microscopy (original magnification, ×200). (C) Morphological alterations of HepG2 cells after treatment with GSE by Wright–Giemsa staining. For dose–response experiments (C), cells were treated with GSE for 24 h. For time-course experiments, cells were treated with 100 μg/mL of GSE (D). Ctrl: control; Veh: vehicle.
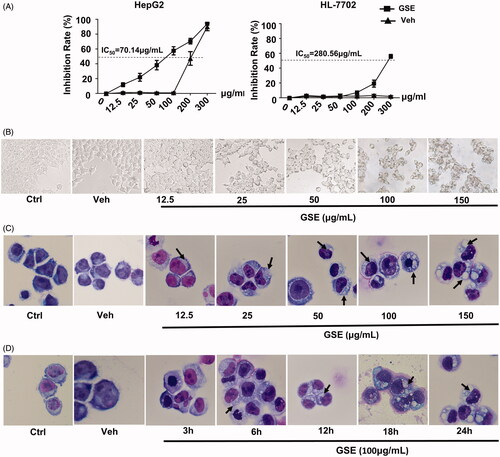
Figure 3. GSE induces cytoplasmic vacuolation originating from the endoplasmic reticulum (ER) in HepG2 cells. (A) Swelling of the ER in HepG2 cells after treatment with 100 μg/mL of GSE for 24 h. Cells were visualized via transmission electron microscopy. Arrowheads indicate the ER. (B) Cytoplasmic vacuolation in HepG2 cells resulting from enlargement of the ER. HepG2 cells were incubated with ER-Tracker Red dye (1 μM) after exposure to GSE for 24 h and were observed via a fluorescence microscope (scale bars, 10 μm). Ctrl: control; Veh: vehicle; N: nuclear: ER: endoplasmic reticulum; DIC: differential interference contrast.
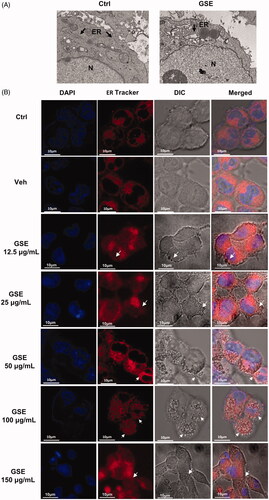
Figure 4. GSE induces endoplasmic reticulum stress and activates the unfolded protein response pathway in HepG2 cells. The expression of ER stress-associated proteins in HepG2 cells after GSE treatment. (A) Cells were treated with GSE at indicated concentration for 24 h. (B) Cells were treated with 100 μg/mL of GSE with difference time exposure. β-Actin was used as a loading control in the western blot analysis. Ctrl: control; Veh: vehicle; p: phosphorylated.
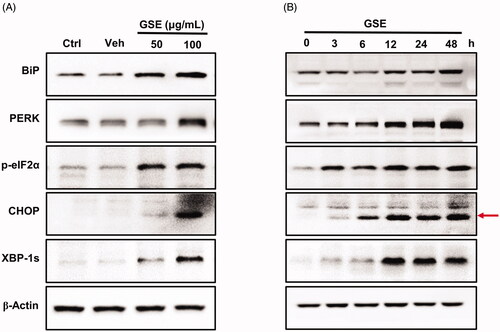
Figure 5. GSE arrests HepG2 cells at the G2/M stage and affects expression of cell cycle regulators. (A) Cell cycle progression of HepG2 cells after treatment with GSE over a period of 24 h; and quantitative distribution of HepG2 cells in different phases of the cell cycle. (B) Data are shown as mean values ± SEM (n = 3). Statistical analysis was carried out by a one-way analysis of variance (ANOVA) followed by Tukey’s pairwise comparisons and p < 0.05 was considered statistically significant. *p < 0.05, **p < 0.01 and ***p < 0.001. (C). Western blot analysis of cell cycle regulatory proteins in HepG2 cells after treatment with GSE for 24 h. Ctrl: control; Veh: vehicle; GSE 50: GSE 50 μg/mL; GSE 100: GSE 100 μg/mL.
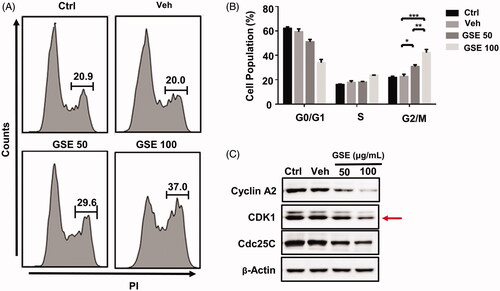
Figure 6. Salubrinal attenuates GSE-induced G2/M cell cycle arrest. (A) HepG2 cells were pre-treated with 25 mM salubrinal for 1 h and further treated with GSE for 24 h to examine cell cycle progression by flow cytometry. (B) Data are shown as mean values ± SEM (n = 3). Statistical analysis was carried out by a one-way analysis of variance (ANOVA) followed by Tukey’s pairwise comparisons and p < 0.05 was considered statistically significant. *p < 0.05 and **p < 0.01. Ctrl: control: Sal: salubrinal; GSE 50: GSE 50 μg/mL; GSE 100: GSE 100 μg/mL.
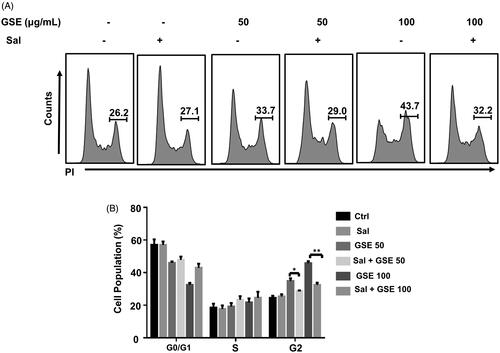
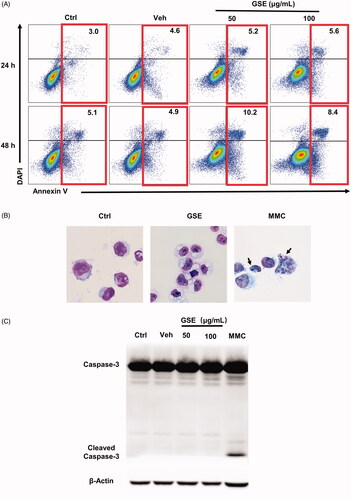
Figure 7. GSE has a negligible effect on the apoptosis of HepG2 cells. (A) Analysis of HepG2 cell apoptosis following GSE treatment. HepG2 tumour cells were cultured with GSE at indicated doses or with emulsion (vehicle), harvested and stained with Annexin V-FITC and DAPI. Numbers in the flow cytometric plots indicate the proportions of gated cells. (B) Cells were stained with Wright–Giemsa staining after treatment with 100 μg/mL GSE for 24 h. Cells were treated with MMC (50 μg/mL) for 24 h as a positive control (original magnification, ×400). Arrowhead indicates a typical fragmented nucleus of a cell undergoing apoptosis. (C) Western blot showing protein levels of caspase-3, cleaved-caspase-3. Ctrl: control: Veh: vehicle: MMC: mitomycin.