Figures & data
Figure 1. Effect of tHGA on (A) vascular leakage with (B) its IC50 and (C) leukocyte infiltration with (D) its IC50 in LPS-induced BALB/c mice. Mice were pre-treated with different doses of tHGA or dexamethasone prior to LPS induction. After 6 h, Evans blue was injected and peritoneal fluid was obtained 30 min later to determine the total vascular leakage. For leukocyte transmigration assay, peritoneal fluid was removed, centrifuged and the cell pellet was stained with Turk’s solution before being counted by using haemocytometer. Data are expressed in mean ± S.E.M. (n = 6), with groups that have no superscript letter in common are significantly different from each other (p ≤ 0.05).
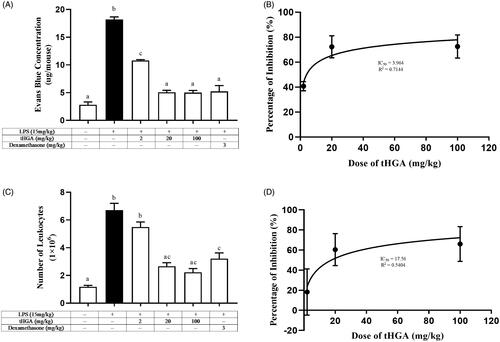
Figure 2. Effect of tHGA on (A) TNF-α level and (B) lung histopathological changes in LPS-induced BALB/c mice. Mice were pre-treated with different doses of tHGA or dexamethasone prior to LPS induction. After 6 h, the serum was collected to measure the level of TNF-α by using ELISA kit. Data are expressed in mean ± S.E.M. (n = 6), with groups that have no superscript letter in common are significantly different from each other (p ≤ 0.05). Representative H&E staining of lung sections of mice pre-treated with different doses of tHGA or dexamethasone under light microscope with 100× and 400× (small boxes). (I) Normal, (II) LPS control, (III) LPS + 20 mg/kg tHGA, (IV) LPS + 40 mg/kg tHGA, (V) LPS + 80 mg/kg tHGA and (VI) LPS + 3 mg/kg dexamethasone. Arrows indicate the infiltration of inflammatory cells.
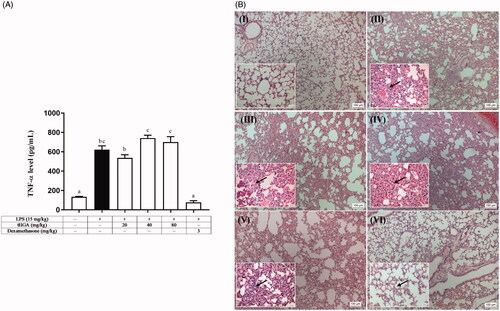
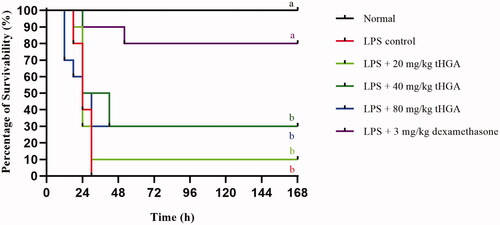
Figure 3. Effect of tHGA on survivability of LPS-induced BALB/c mice. Mice were pre-treated with different doses of tHGA or dexamethasone for 1 h prior to LPS induction. The mice were then returned to their individual cages and monitored for survivability at intervals of 6 h up to 168 h. Data are expressed in mean ± S.E.M. (n = 10), with groups that have no superscript letter in common are significantly different from each other (p ≤ 0.05).