Figures & data
Table 1. The effect of the VB on weights of body and testis.
Table 2. The effect of the VB on sperm count and viability.
Figure 1. Histologic findings in testis. (A) Histological changes in the testis. Original magnifications 100×, 200×. (B) Spermatogenic cell density. (C) Johnsen’s score of the seminiferous tubules. *p < 0.05 vs. VCL-vehicle group, #p < 0.05 vs. Control group.
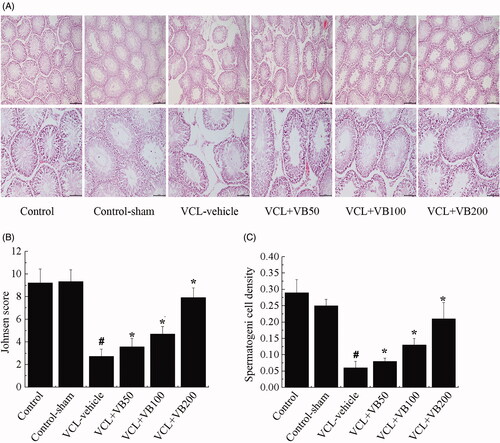
Figure 2. TUNEL assays for the measurement of germ cell apoptosis. (A) TUNEL-staining in each group. Original magnifications 400× (B) Mean apoptotic nuclei/tubule. (C) Apoptotic tubules (%). *p < 0.05 vs. VCL-vehicle group, #p < 0.05 vs. Control group.
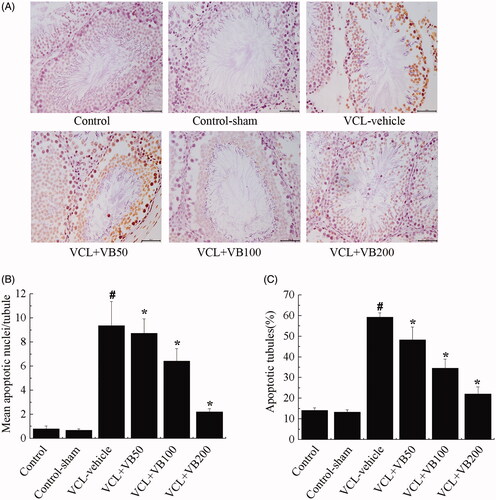
Figure 3. The hormone levels in each group. (A) LH levels. (B) FSH levels. (C) testosterone levels. (D) GnRH levels. *p < 0.05 vs. VCL-vehicle group, #p < 0.05 vs. Control group.
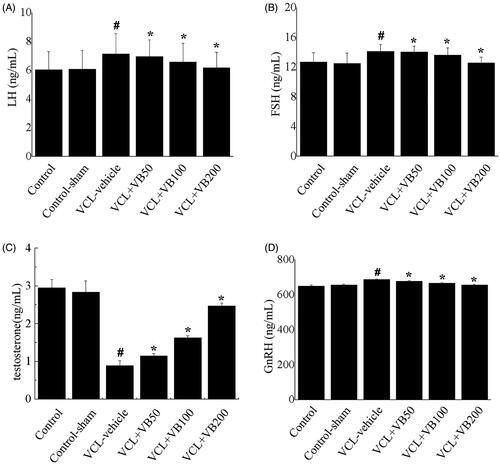
Figure 4. Testicular antioxidant status in each group. (A) MDA levels. (B) SOD levels. (C) GSH levels. (D) GPx levels. *p < 0.05 vs. VCL-vehicle group, #p < 0.05 vs. Control group.
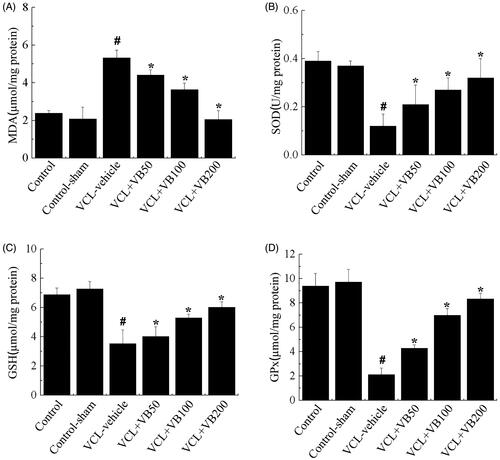
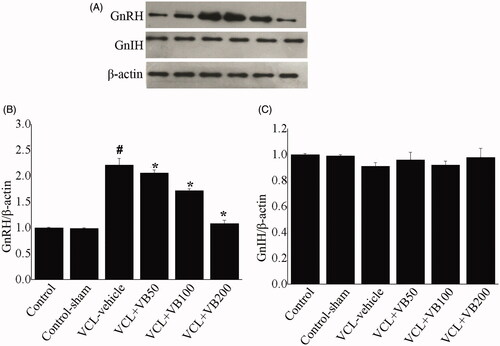
Figure 5. The protein levels of GnRH and GnIH. (A) Western-blot was performed to determine the GnRH and GnIH level in each group. (B) Quantification of GnRH expression. (C) Quantification of GnIH expression. *p < 0.05 vs. VCL-vehicle group, #p < 0.05 vs. Control group.