Figures & data
Figure 1. Chemical structures of (A) gallic acid, (B) protocatechuic acid, (C) vanillic acid, (D) quercitrin, (E) quercetin and (F) kaempferol.
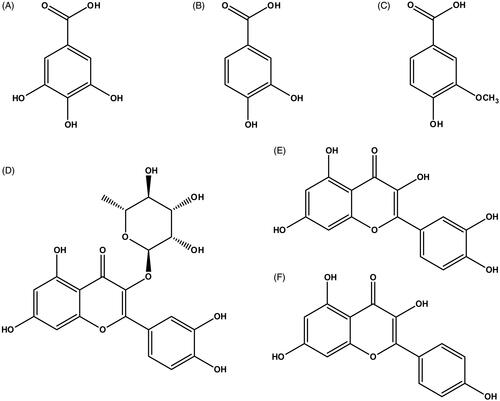
Figure 2. Typical chromatograms of (1) gallic acid, (2) protocatechuic acid, (3) quercitrin, (4) quercetin and (5) kaempferol obtained from an analysis of standard solution (A) and RLQ solution (B).
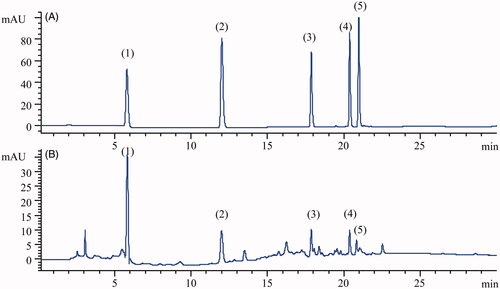
Figure 3. Multiple reaction monitoring chromatograms of (A) blank plasma; (B) blank plasma spiked with a standard mixture of gallic acid (GA, 1) and protocatechuic acid (PCA, 2) at the LLOQ level with internal standard (IS, 3); (C) human plasma sample taken 2 h following the oral administration of RLQ to human subjects.
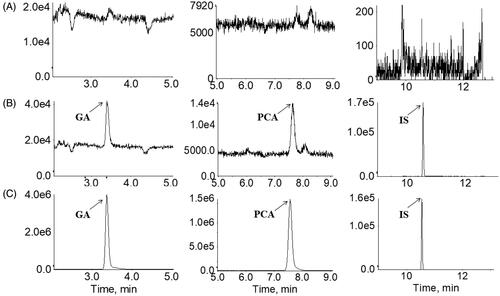
Table 1. Accuracy, precision, recovery and matrix effect for analysis of gallic acid (GA) and protocatechuic acid (PCA) in quality control samples (n = 6).
Table 2. Stability of gallic acid (GA) and protocatechuic acid (PCA) in quality control samples (n = 3).
Table 3. Demographic characteristics of healthy subjects in this study (n = 12).
Figure 4. Plasma concentration-time and semilogarithmic scale profiles of gallic acid (A and B) and protocatechuic acid (C and D) after oral administration of single (▲) and multiple (▼) doses of Relinqing granules (RLQ, 8 g) in human subjects (means ± SD, n = 12).
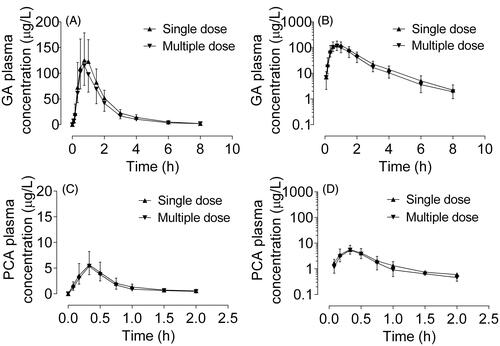
Table 4. Pharmacokinetic parameters of gallic acid and protocatechuic acid after oral administration of single and multiple doses of Relinqing to human subjects (means ± SD, n = 6).
Figure 5. Urinary concentration-time profiles of gallic acid (GA, A) and protocatechuic acid (PCA, B), and urinary recovery-time curves of GA (C) and PCA (D) after oral administration of single (▲) and multiple (▼) doses of Relinqing granules (8 g) to human subjects, as well as the cumulative urinary recoveries of GA (E) and PCA (F) in urine (means ± SD, n = 12).
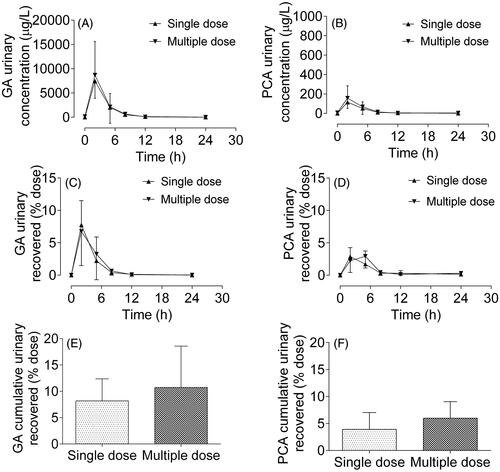
Figure 6. Gender difference on the main pharmacokinetic parameters Cmax (A) and AUC0–t (B) of gallic acid, and Cmax (C) and AUC0–t (D) of protocatechuic acid after single and multiple doses of Relinqing granules (8 g) in human subjects (means ± SD, n = 6).
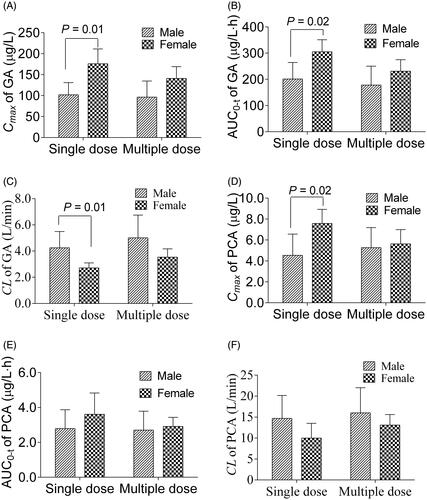
Figure 7. Inhibitory effects of gallic acid (GA) and protocatechuic acid (PCA) on the uptake of 14C-amino hippuric acid (14C-PAH, A), 3H-estrone sulphate-ammonium salt (3H-ES, B),14C-tetraethylammonium bromide (14C-TEA, C) and 3H-ES (D) into MDCK-hOAT1, S2-hOAT3, S2-hOCT2 and HEK293-hOATP1B1 cells, respectively.
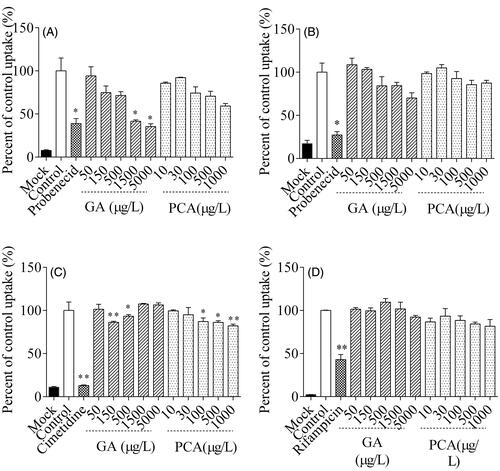
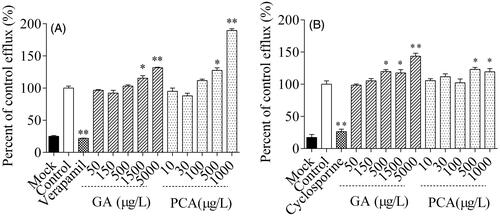
Figure 8. Inhibitory effects of gallic acid (GA) and protocatechuic acid (PCA) on the efflux of rhodamine 123 (A) and lucifer yellow (B) across MDCK-hMDR1 and MDCK-hBCRP cells, respectively.