
Figures & data
Figure 1. The structure of paeoniflorin (A, C23H28O11, 480.45) and albiflorin (B, C23H28O11, 480.45).
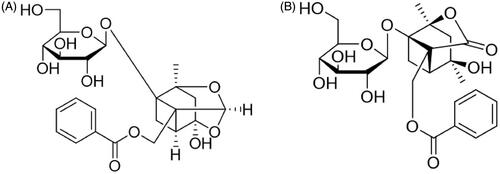
Figure 2. The full chromatographic spectrum of TGP (1. Gallic acid; 2. Hydroxypaeoniflorin; 3. Catechin; 4. Albiflorin; 5. Paeoniflorin; 6. Pentagalloyl glucose; 7. Benzoic acid; 8. Benzoylpaeoniflorin; 9. Paeonol).
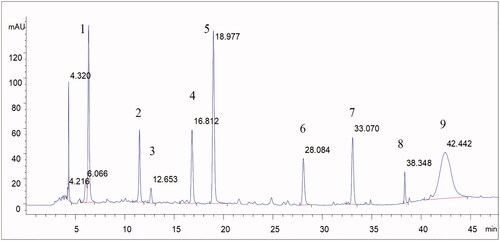
Figure 3. MRM chromatograms of paeoniflorin, albiflorin and gentiopicroside (IS). (A) blank serum; (B) blank serum spiked with paeoniflorin, albiflorin and IS (30, 15 and 1 μg/mL respectively; (C) rat serum collected at 10 min after administration of 2.82 g/kg TGP.
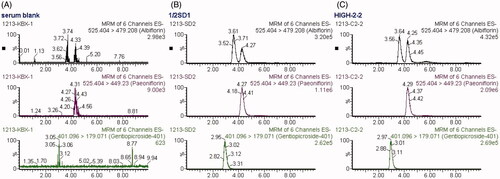
Table 1. Precision and accuracy for the assay of paeoniflorin and albiflorin in rat serum (n = 6).
Table 2. Stability of paeoniflorin and albiflorin in rat serum and standard solutions (n = 6).
Figure 4. Mean serum concentration–time curves of paeoniflorin (A) and albiflorin (B) after intragastric administration of 2.82, 1.41 and 0.705 g/kg TGP in CCl4-induced hepatic injury rats (n = 6).
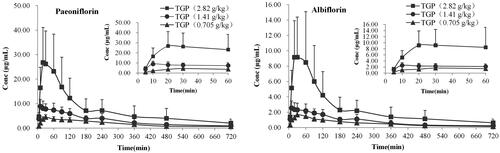
Table 3. Pharmacokinetic parameters of paeoniflorin and albiflorin in CCl4-induced hepatic injury rats after intragastric administration of 2.82, 1.41 and 0.705 g/kg TGP (n = 6).
Figure 5. Serum ALT (A), AST (B) and TBA (C) levels in rats at pre-disease modelling (Pre-M), after-disease modelling (After-M), 3 h after drug administration (Treated-3 h), 8 h after drug administration (Treated-8 h) and 20 h after drug administration (Treated-20 h). (n = 6, **p < 0.01 vs. pre-M, #p < 0.05, ##p < 0.01 vs. after-M).
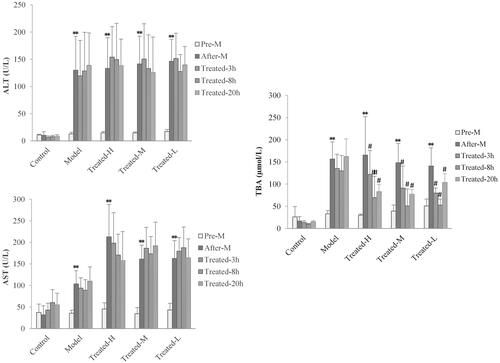
Figure 6. Serum ALT (A), AST (B) and TBA (C) levels over time in the Control, Model, Treated-H, Treated-M and Treated-L groups after single dose administration, respectively (n = 6). Treated-H group: *p < 0.05, **p < 0.01 vs. Time = 0; Treated-M group: #p < 0.05, ##p < 0.01 vs. Time = 0; Treated-L group: Δp < 0.05, ΔΔp < 0.01 vs. Time = 0.
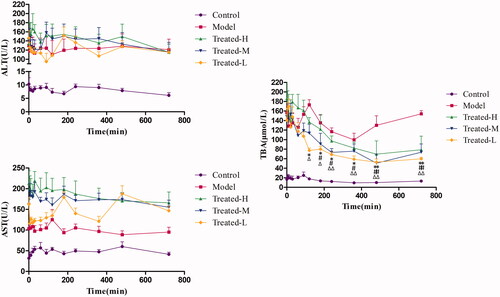
Figure 7. The observed mean serum TBA levels effect (TBA-obs) and the predicted mean serum TBA levels effect (TBA-pre) vs paeoniflorin and albiflorin concentration after oral administration of 2.82 (A), 1.41 (B) and 0.705 g/kg (C) TGP in CCl4-induced acute hepatic injury rats.
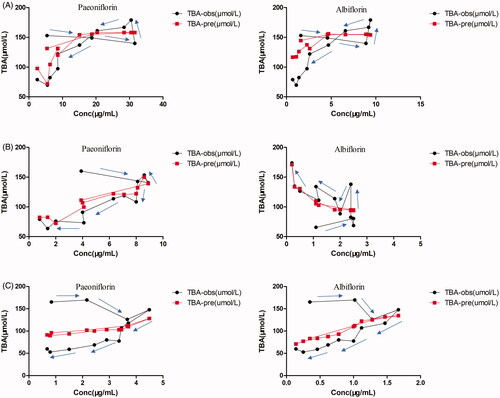
Table 4. Mean pharmacodynamic parameters of paeoniflorin and albiflorin for reducing serum TBA levels effect after oral administration of 2.82, 1.41 and 0.705 g/kg TGP in CCl4-induced acute hepatic injury rats.