Figures & data
Table 1. Primer information.
Figure 1. WTD attenuates RA in a rat model. Rats in the RA and RA + WTD groups were injected in the right hind footpad with 0.1 mL complete Freund’s adjuvant containing 10 mg/mL dead Mycobacterium tuberculosis. Rats in the RA + WTD group were additionally intragastrically administered WTD crude extract at a dose of 9.8 g/kg/day for 15 days. (A) The swelling of the hind paw was evaluated on days 1, 2, 5, 10, and 15. (B) The thickness of the articular cartilage layer in each group was evaluated by Safranin O/Fast Green staining.
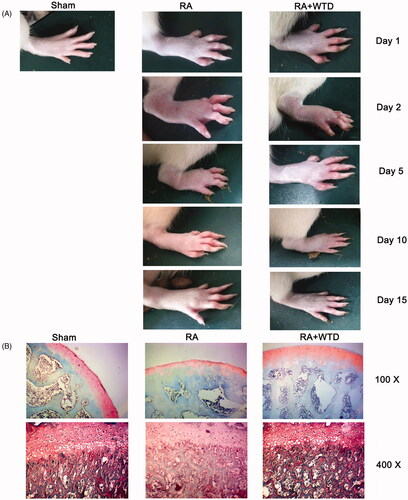
Figure 2. SHC1 signal in chondrocytes is regulated by IL-1β and WTD. CHON-001 cells were stimulated with 10 ng/mL IL-1β to establish the RA model. WTD (1 μg/mL) and Ras inhibitor BI-3406 (1 μM) were added to CHON-001 samples to determine their effect against IL-1β. SHC1 was knocked down in chondrocytes before exposure to IL-1β. (A) PCR and (B) western blot assays were conducted to assess the expression of the indicated genes and proteins, respectively. **p < 0.01 and ***p < 0.001 vs. Control group; #p < 0.05, ##p < 0.01, and ###p < 0.001 vs. IL-1β group.
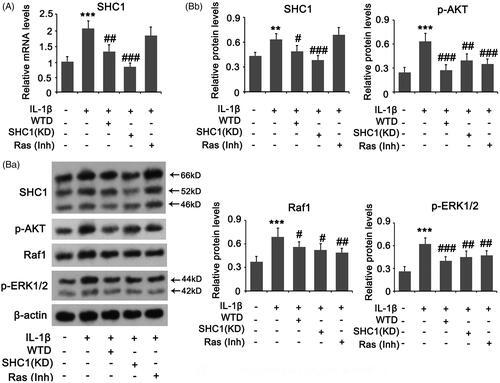
Figure 3. SHC1 is implicated in the protective effect of WTD against IL-1β-detrimental effects. CHON-001 cells were stimulated with 10 ng/mL IL-1β to establish the RA model. WTD (1 μg/mL) and Ras inhibitor BI-3406 (1 μM) were added to CHON-001 to determine their effect against IL-1β. SHC1 was knocked down in chondrocytes before exposure to IL-1β. (A) Cell viability was evaluated by the MTT assay. (B) Apoptosis rate was evaluated by flow cytometry. (C) Aggrecan, COL2A1, and MMP-13 expressions in chondrocytes were determined by PCR. (D) Intracellular ROS levels were evaluated by a DCFH-DA probe using flow cytometry. ***p < 0.001 vs. control group; #p < 0.05, ##p < 0.01, and ###p < 0.001 vs. IL-1β group.
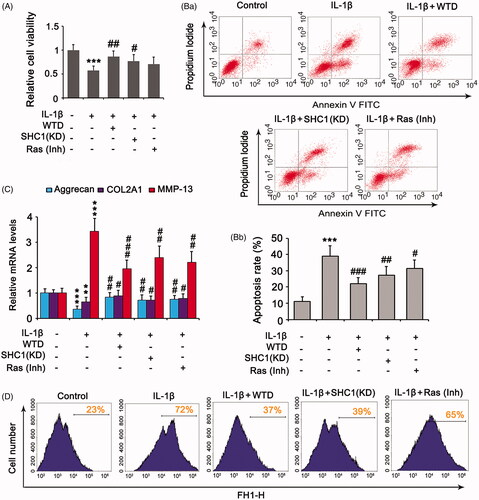
Figure 4. WTD suppresses SHC1 expression in chondrocytes by inducing LOC101928120. (A) Genome Browser Gateway analysis showed that the SHC1 gene is located in the antisense strand of DNA near the LOC101928120 gene in the sense strand. (B) PCR was performed to detect the percentage of LOC101928120 in the nucleus and cytoplasm. U1: U1 snRNA. (C) PCR was performed to detect the LOC101928120 expression in chondrocytes after treatments with IL-1β and/or WTD. ***p < 0.001 vs. control group. (D) PCR was performed to detect LOC101928120 and SHC1 expressions in chondrocytes after LOC101928120 knockdown and overexpression. ***p < 0.001 vs. control group. € PCR was performed to detect SHC1 expression in chondrocytes after treatments with IL-1β and WTD and knockdown of LOC101928120. ***p < 0.001 vs. control group; ##p < 0.01 vs. IL-1β group. (F) Genome Browser Gateway analysis showed that the promoter of the SHC1 gene is vulnerable to histone methylation and acetylation. (G) The interaction of LOC101928120 with HDAC1 was analyzed using the catRAPID web. (H) RNA pull-down assay was conducted to confirm the interaction between LOC101928120 and HDAC1. (I) In another RNA pull-down assay, several regions of Bio-LOC101928120 and the antisense of LOC101928120 were used to pull down HDAC1. Only the sequences LOC101928120 from 1 to 300 bp and 100 to 400 bp pulled down HDAC1. (J) ChIP assay was performed to determine the interaction of HDAC1 and acetylated Histone 3 with the promoter of the SHC1 gene. ***p < 0.001 vs. IgG group; #p < 0.05, and ###p < 0.001 vs. control group.
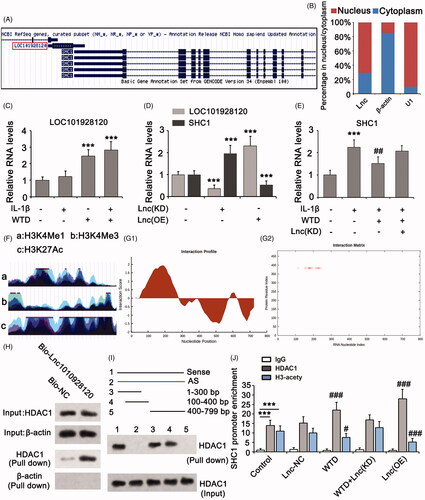
Figure 5. WTD up-regulates LOC101928120 by stimulating Ahr. (A) Bioinformatics analysis using Jasper 2020 showing that the LOC101928120 gene is likely a target of Ahr. (B) The gene sequence is specifically targeted by Ahr. (C) A luciferase reporter assay was performed to confirm the interaction of Ahr with the promoter region of LOC101928120 gene from −1285 to −1290 bp, as this region showed the highest score in the bioinformatics analysis. (D) ChIP assay was conducted to determine whether the interaction between Ahr and LOC101928120 gene promoter is influenced by WTD. (E) Western blot assay was performed to determine the protein level of Ahr in chondrocytes and the cytoplasm and cell nucleus after WTD treatment. **p < 0.01 vs. control group; *p < 0.05, ***p < 0.001 vs. control group.
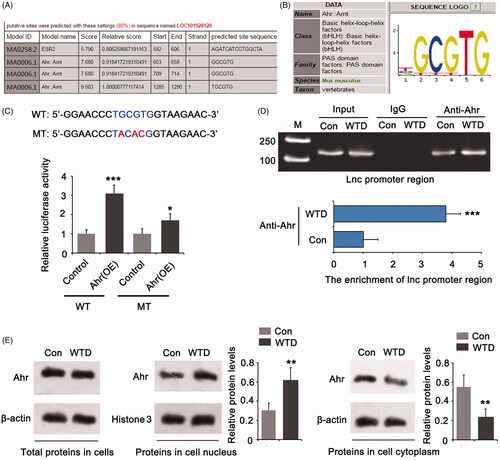
Figure 6. The protective effect of WTD against IL-1β is associated with LOC101928120. CHON-001 cells were treated with 10 ng/mL IL-1β alone or in combination with 1 μg/mL WTD. LOC101928120 was knocked down or overexpressed before the cell treatments. (A) Cell viability was evaluated by the MTT assay. (B) Apoptosis rate was evaluated by flow cytometry. (C) Aggrecan, COL2A1, and MMP-13 expression in chondrocytes was determined by PCR. (D) Intracellular ROS levels were evaluated by a DCFH-DA probe using flow cytometry. ***p < 0.001 vs. control group; #p < 0.05, ##p < 0.01, and ###p < 0.001 vs. IL-1β group. &p < 0.05 and &&p < 0.01 vs. IL-1β + WTD group.
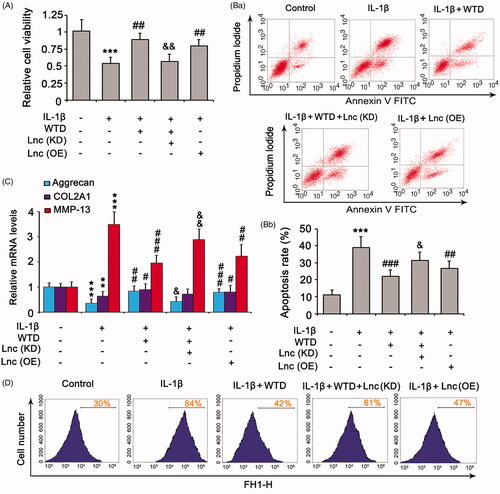
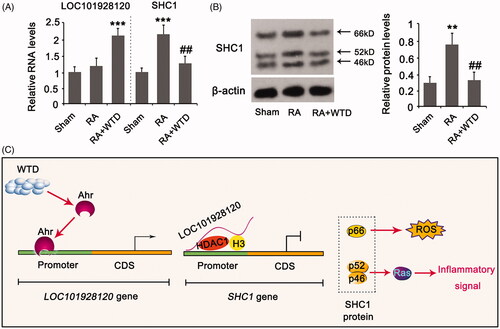
Figure 7. WTD regulated LOC101928120 and SHC1 expression in the articular cartilage of rats in RA. Rats in the RA and RA + WTD groups were injected in the right hind footpad with 0.1 mL complete Freund’s adjuvant containing 10 mg/mL dead Mycobacterium tuberculosis. Rats in the RA + WTD group were additionally intragastrically administered WTD crude extract at a dose of 9.8 g/kg/day for 15 days. (A) PCR and (B) western blot assays were performed to determine LOC101928120 and/or SHC1 expression in the articular cartilage of rats. (C) According to the results from this study, we showed the molecular mechanism underlying WTD protection in chondrocytes against IL-1β. **p < 0.001 and ***p < 0.001 vs. control group; ##p < 0.01 vs. IL-1β group.