Figures & data
Figure 1. Schizandrin improved spatial learning and memory ability and reduced the levels of Aβ1-42 and Aβ1-40 in Alzheimer’s disease mice. APP/PS1 mice received Sch A or distilled water administration. C57BL/6 WT mice served as control. Morris water maze test was performed to analyse the escape latency (A), path length (B), the percentage of total time in the target quadrant (C) and the time of crossing platform (D) of mice. (E,F) The levels of Aβ1-42 and Aβ1-40 in the brain tissues of mice were estimated by ELISA. **p < 0.01 vs. WT; #p < 0.05, ##p < 0.01 vs. AD.
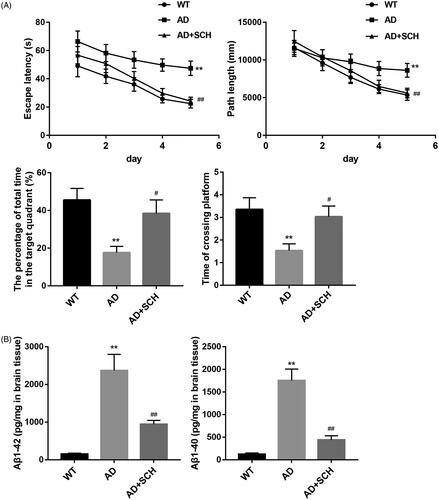
Figure 2. Schizandrin inhibited cell apoptosis in brain tissues of Alzheimer’s disease mice. APP/PS1 mice received Sch A or distilled water administration. C57BL/6 WT mice served as control. TUNEL assay was performed to assess cell apoptosis in brain tissues of mice. **p < 0.01 vs. WT; ##p < 0.01 vs. AD.
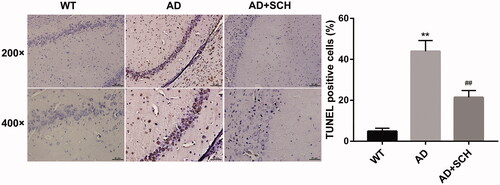
Figure 3. Schizandrin treatment inhibited M1 microglial polarisation and promoted M2 microglial polarisation in Alzheimer’s disease mice. APP/PS1 mice received Sch A or distilled water administration. C57BL/6 WT mice served as control. (A) The proportions of Iba-1+, iNOS+ and Arg-1+ microglial cells in brain tissues of mice was assessed by immunohistochemistry. (B) The expression of IL-6 and IL-10 in the brain tissues of mice was detected by qRT-PCR. **p < 0.01 vs. WT; ##p < 0.01 vs. AD.
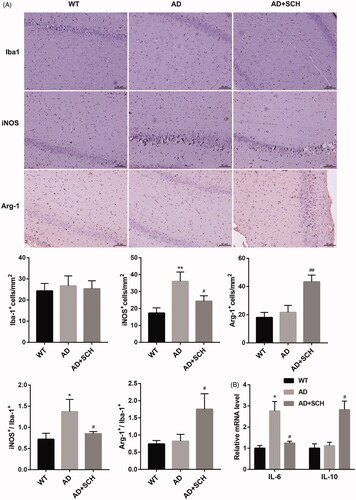
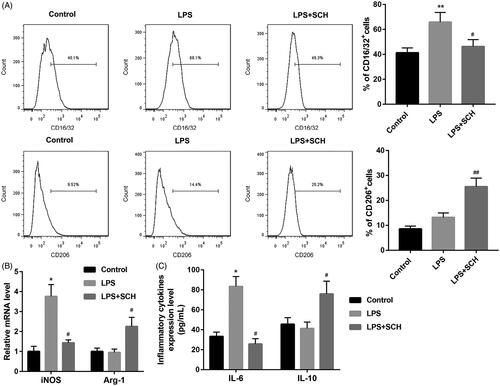
Figure 4. Schizandrin treatment inhibited M1 microglial polarisation and promoted M2 microglial polarisation in BV2 cells. BV2 cells were treated with LPS or combined with Sch A. Normal BV2 cells served as control. (A) Flow cytometry was performed to assess the proportions of M1 and M2 microglia in the BV2 cells. (B) The expression of iNOS and Arg-1 in the BV2 cells was detected by qRT-PCR. (C) The levels of IL-6 and IL-10 in the BV2 cells were estimated by ELISA. *p < 0.05, **p < 0.01 vs. Control, #p < 0.05, ##p < 0.01 vs. LPS.