Figures & data
Figure 1. Experimental design.
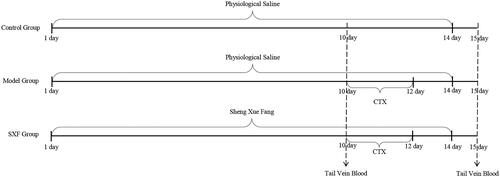
Figure 2. Routine blood parameters. (A) WBC relative change in male mice; (B) RBC relative change in male mice; (C) WBC relative change in female mice; (D) RBC relative change in female mice; (E) HCT relative change in female mice; (F) HGB relative change in female mice. Control: control group; Model: model group (CTX group); Low: low dose group; Middle: middle dose group; High: high dose group. Note: The Y-axis of (D–F) is displayed in −%. *p < 0.05; **p < 0.01.
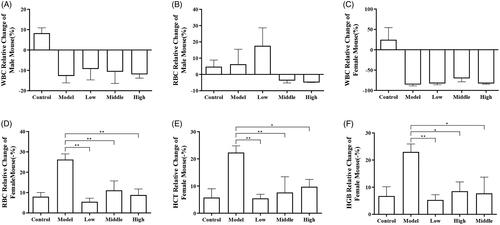
Figure 3. Histopathology of the spleen. (A) Splenic index; (B) Spleen of the control group; (C) Spleen of the model group; (D) Spleen of the low-dose group; (E) Spleen of the middle dose group; (F) Spleen of the high-dose group. *p < 0.05; **p < 0.01.
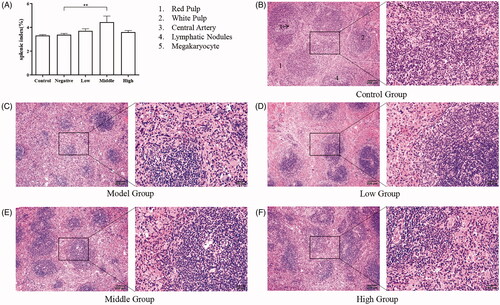
Figure 4. Histopathological observations of femoral bone marrow. (A) Femoral bone marrow of the control group; (B) Femoral bone marrow of the model group; (C) Femoral bone marrow of the low-dose group; (D) Femoral bone marrow of the middle dose group; (E) Femoral bone marrow of the high-dose group.
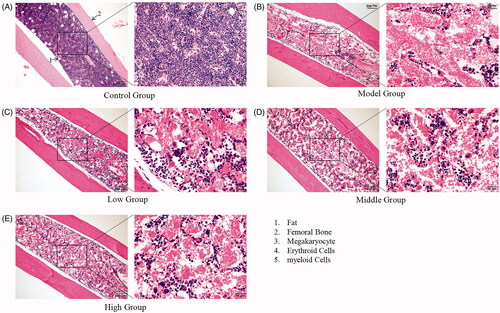
Figure 5. ‘Natural medicines–active component–target’ network.
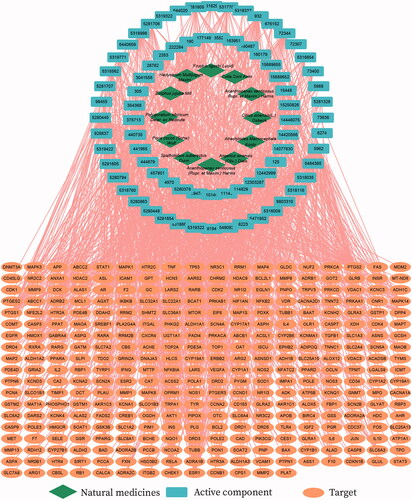
Table 1. Top 10 key nodes of natural medicines and actin target.
Table 2. Top 15 in the SXF PPI network ranked by degree.
Figure 6. Enrichment analysis. (A) GO enrichment analysis; (B) KEGG enrichment analysis.
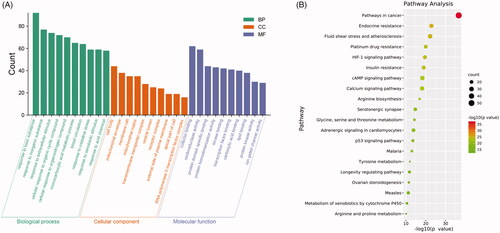
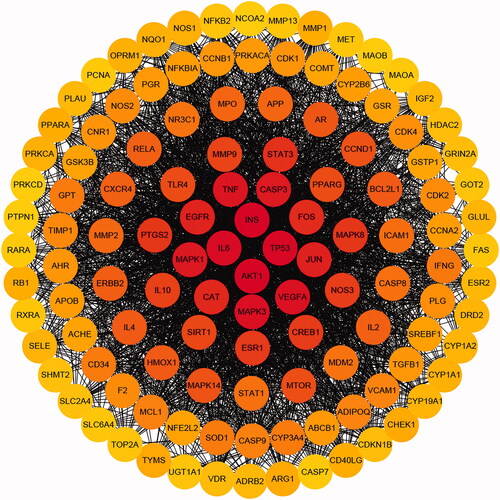
Figure 7. PPI network. The darker the colour, the greater the degree.