Figures & data
Table 1. Primer sequences of IL-1β, IL-6, TNF-α, MCP-1 and GAPDH.
Figure 1. Effects of PTH on infarct volume and neurological deficits in MCAO rats. (A) Representative T2-weighted images of brain sections in different groups (n = 6). (B) Quantitative analysis of infarct volume in different groups (n = 6). (C) Quantitative analysis of neurological deficits in different groups (n = 6). Data are presented as mean ± SEM. **p < 0.01 vs. Sham; #p < 0.05 vs. MCAO.
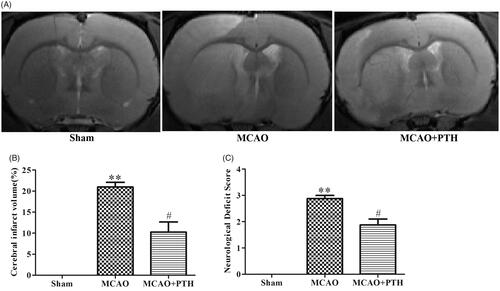
Figure 2. Effects of PTH on the cerebral histopathological changes in MCAO rats (n = 6). Haematoxylin-eosin-stained slides of the brain sections in different groups were examined under a light microscope. Normal neurons were arranged in a regular manner with intact structure (white arrow). Abnormal neurons exhibited obvious disordered arrangement, nuclei shrinkage and dark staining (red arrow). Scale bar = 100 μm.
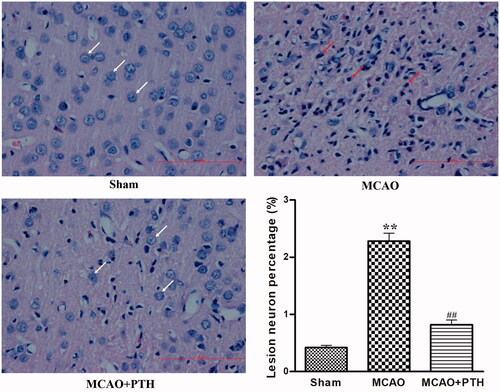
Figure 3. Effects of PTH on cerebral IL-1β (A), IL-6 (B), TNF-α (C), and MCP-1 (D) mRNA levels in MCAO rats (n = 3). Data are presented as mean ± SEM. **p < 0.01 vs. Sham; ##p < 0.01 vs. MCAO.
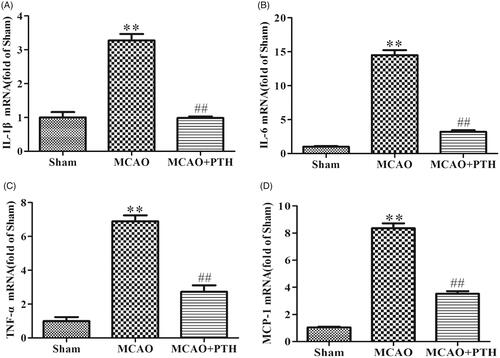
Figure 4. Effects of PTH on the number of Iba-1 positive cells and the protein expressions of GFAP, iNOS and COX-2 in MCAO rats (n = 3). (A) Representative Iba-1-staining brain sections in different groups (n = 3). (B) Quantitative analysis of Iba-1 positive cells in different groups (n = 3). (C-E) Representative western blot and quantitative analysis of GFAP (C), iNOS (D) and COX-2 (E) protein expression in different groups (n = 3). Data are presented as mean ± SEM. **p < 0.01 vs. Sham; #p < 0.05, ##p < 0.01 vs. MCAO.
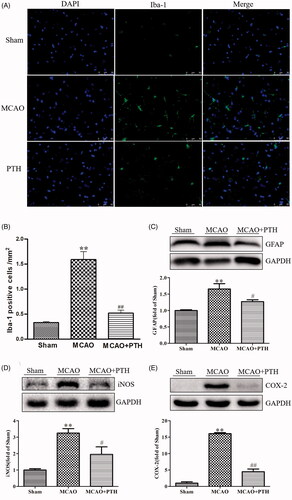
Figure 5. Effects of PTH on TLR4 (A), MyD88 (B), and TRAF6 (C) protein expression in MCAO rats (n = 3). Data are presented as mean ± SEM. *p < 0.05, **p < 0.01 vs. Sham; #p < 0.05, ##p < 0.01 vs. MCAO.
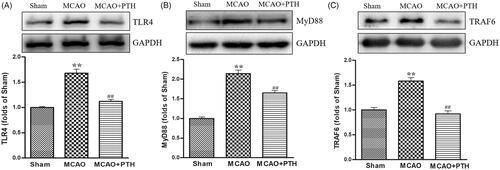
Figure 6. Effects of PTH on the NF-κB p65 pathway in MCAO rats (n = 3). (A) Representative western blot and quantitative analysis of IkBα in different groups. (B) Representative western blot and quantitative analysis of NF-κB p65 in different groups. (C) Representative immunofluorescent staining sections in different groups. (D) Quantitative analysis of the nucleus/cytoplasm ratio of NF-κB p65 in different groups. The cytosolic/nuclear translocation of NF-κB p65 was examined using immunofluorescent staining (magnification, ×200). NF-κB p65 of the normal neurons was expressed in the cytoplasm (white arrow). NF-κB p65 of the abnormal neurons was highly expressed in the nucleus (red arrow). Data are presented as mean ± SEM. *p < 0.05, **p < 0.01 vs. Sham; #p < 0.05, ##p < 0.01 vs. MCAO. Scale bar = 50 μm.
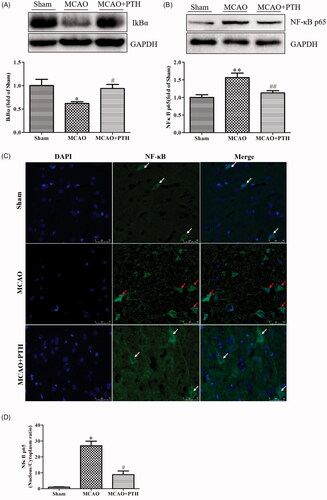
Figure 7. Effects of PTH on p-ERK1/2/ERK1/2 (A), p-JNK/JNK (B), and p-p38/p-38 (C) protein expression in MCAO rats (n = 3). Data are presented as mean ± SEM. **p < 0.01 vs. Sham; #p < 0.05, ##p < 0.01 vs. MCAO.
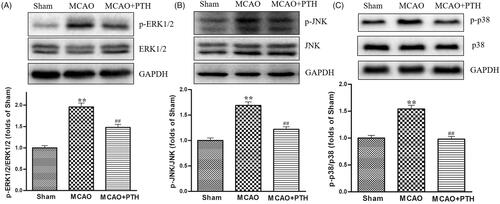
Figure 8. TAK-242 did not obviously enhance the anti-inflammatory effect of PTH on cerebral ischaemic injury. (A) Representative T2-weighted images of brain sections in different groups (n = 6). (B) Quantitative analysis of infarct volume in different groups (n = 6). (C) Quantitative analysis of neurological deficits in different groups (n = 6). (D-F) Quantitative analysis of IL-1β (D), IL-6 (E) and TNF-α (F) mRNA levels in different groups (n = 3). Data are presented as mean ± SEM. **p < 0.01 vs. Sham; #p < 0.05, ##p < 0.01 vs. MCAO.
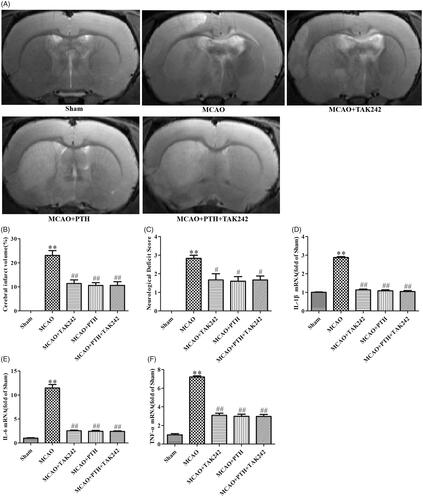
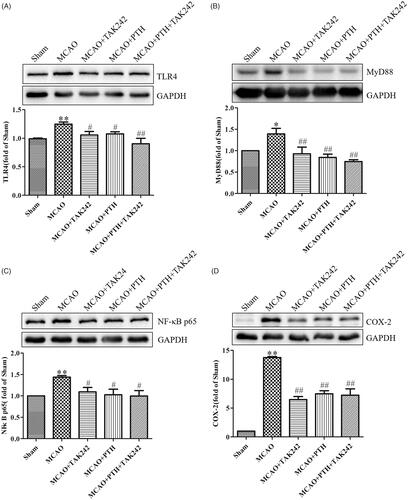
Figure 9. Combined administration of PTH and TAK-242 did not enhance the effects of PTH in MCAO rats. Representative western blot and quantitative analysis of TLR4 (A), MyD88 (B), NF-κB p65 (C), and COX-2 (D) in different groups (n = 3). Data are presented as mean ± SEM. *p < 0.05, **p < 0.01 vs. Sham; #p < 0.05, ##p < 0.01 vs. MCAO.