
Figures & data
Figure 1. PTPRM was down-regulated in GBM cells. (A) Bioinformatics analysis with GEPIA was performed to detect PTPRM expression in GBM. (B) The mRNA levels of FN1 and PTPRM were quantified by qRT-PCR. (C) The protein levels of FN1, PTPRM, and p-STAT3 were detected by western blot. *p < 0.05 vs. Normal. **p < 0.01 vs. NSC. ***p < 0.001 vs. NSC.
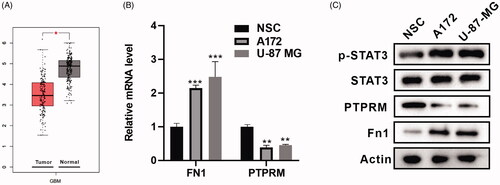
Figure 2. PTPRM and phosphorylation of STAT3 levels were associated with the proliferation of GBM cells. A172 and U-87 MG cells were transfected with oe-PTPRM or sh-PTPRM and their negative controls (NC). (A) The mRNA level of PTPRM was quantified by qRT-PCR. (B) The protein levels of PTPRM and p-STAT3 were detected by western blot. (C) A172, U-87 MG cells were treated with sh-PTPRM or sh-NC or stattic (STAT3 inhibitor). The colony formation assay was used to detect and compare the cell cloning formation. **p < 0.01 vs. sh-NC. ***p < 0.001 vs. sh-NC or oe-NC. #p < 0.05 vs. sh-PTPRM. ##p < 0.01 vs. sh-PTPRM.
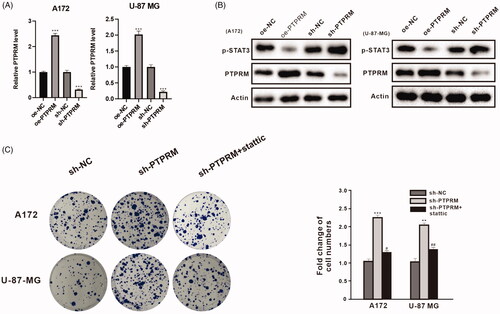
Figure 3. DNA methylation affected PTPRM expression, the phosphorylation level of STAT3, and proliferation of GBM. A172, U-87 MG, and NSCs were treated with 5-aza (1uM). (A) The mRNA level of PTPRM was quantified by qRT-PCR. (B) The protein level of PTPRM was examined by western blot. (C) The online analysis software (http://www.urogene.org/cgi-bin/methprimer/methprimer.cgi) was used to analyze the PTPRM promoter region. (D) MSP was performed to detect the PTPRM methylation levels. (E) STAT3 phosphorylation level was evaluated using western blot. (F) MTT assay was used to detect cell proliferation. *p < 0.05 vs. 0 h. **p < 0.01 vs. 5-aza (−). ***p < 0.001 vs. 5-aza (−). #p < 0.05 vs. 2 h.
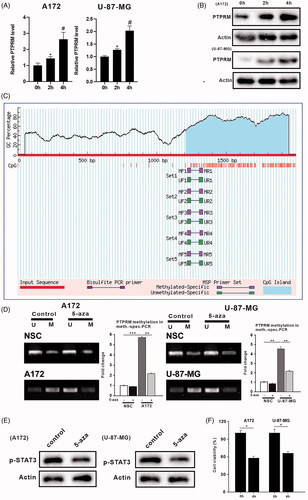
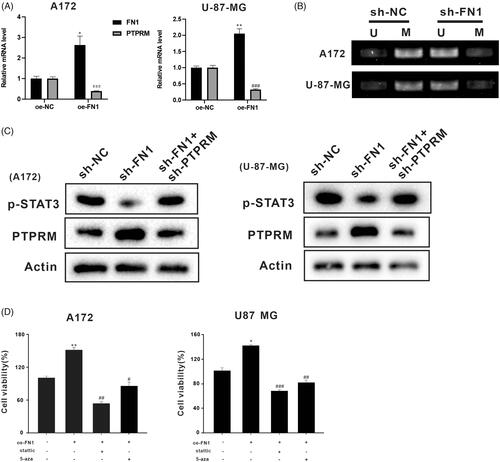
Figure 4. FN1 regulated PTPRM expression through DNA methylation. The oe-FN1, sh-FN1, and sh-FN1 + sh-PTPRM particles were transfected into A172 and U-87 MG cells. (A) The mRNA levels of PTPRM were detected by qRT-PCR. (B) MSP was performed to detect the PTPRM methylation levels after the knockdown of FN1. (C) Protein levels of PTPRM and STAT3 phosphorylation were determined by western blot. (D) Cell viability was detected by MTT assay. *p < 0.05 vs. Normal or oe-NC. **p < 0.01 vs. Normal or oe-NC. #p < 0.05 vs. oe-FN1. ##p < 0.01 vs. oe-FN1. ###p < 0.001 vs. oe-FN1 or oe-NC.