Figures & data
Figure 1. Chemical structures and MS/MS spectra of laurolitsine and nuciferine.
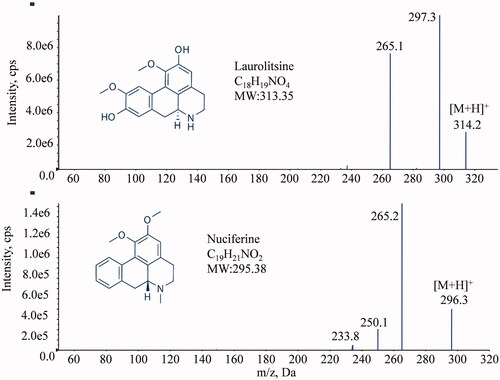
Figure 2. LC-MS/MS chromatograms oflaurolitsine and IS nuciferine in different matrix. (A) Blank biological matrix; (B) LLOQ sample of different biological matrix (laurolistine 1 ng/mL−1); (C) rat plasma of 1 h after i.v. administration laurolistine, rat urine of 0–4 h after p.o. administration laurolistine, rat liver tissue of 2 h after p.o. administration laurolistine; (D) rat plasma of 1 h after p.o. administration laurolitsine.
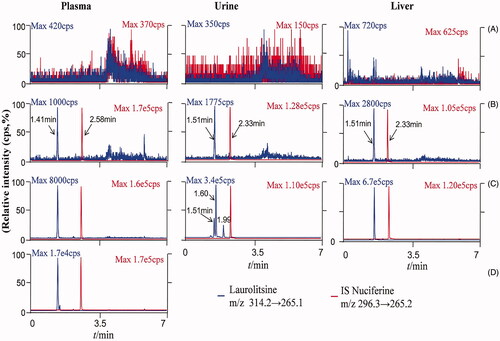
Table 1. Standard calibration curves and LLOQ of laurolitsine in different matrix.
Table 2. Intra-day and inter-day precision, accuracy of laurolitsine.
Table 3. Stability of laurolitsine in plasma, liver, kidney, urine, faeces (n = 6).
Table 4. Extraction recovery and matrix effect of laurolitsine (Mean ± SD, n = 6).
Figure 3. Plasma concentration-time curve of laurolitsine after i.g. (10 mg/kg) and i.v. (2 mg/kg) administration to SD rats (n = 5).
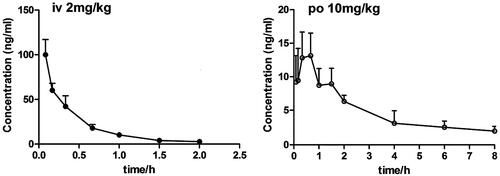
Table 5. Pharmacokinetic parameters of laurolitsine after i.g. and i.v. admininstration.
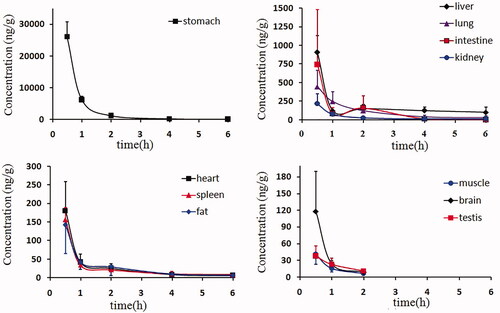
Figure 4. The mean tissue drug concentrations at 0.5, 1, 2, 4, and 6 h after the oral administration of 10 mg/kg laurolitsine.
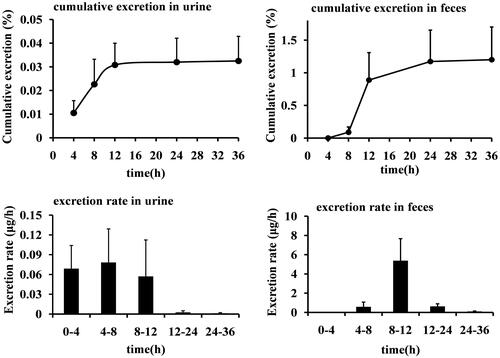
Figure 5. The cumulative excretion of laurolitsine in the urine and faeces of rats after oral administration 10 mg/kg as a percentage of the dosage and excretion rate.