Figures & data
Figure 1. Behavioural evaluation of TIV-treated CUMS mice and controls. (A) Changes in body weight. (B) Immobility time in TST for CUMS mice with TIV treatment. (C) Sucrose preference in SPT for CUMS mice with TIV treatment. Data are reported as mean ± SD. # p < 0.05 and ## p < 0.01 vs. the normal group. *p < 0.05 and **p < 0.01 vs. the model group. N: normal; M: model; S: fluoxetine; L: TIV-L; Me: TIV-M; H: TIV-H.
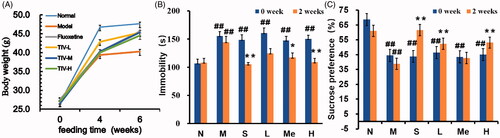
Figure 2. Reflectance curve (A) and Venn diagram (B) of intestinal microbial OTUs from TIV-treated CUMS mice and controls. (C) The alpha diversity of the Shannon index of intestinal microflora. (D) Analysis of principal coordinates based on Bray-Curtis distance (the stress values in the NMDS analysis of the differences between communities). Data are reported as mean ± SD. N: normal group; M: model; S: fluoxetine; L: TIV-L; Me: TIV-M; H: TIV-H (n = 3 per group).
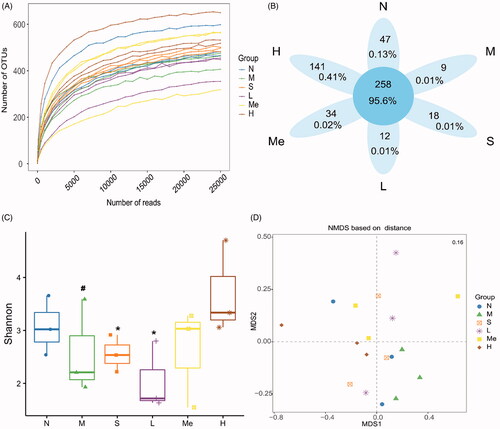
Figure 3. Comparison of gut microflora of (A) Barplot of relative abundance at the phylum level; the relative abundance of (B) Firmicutes, (C) Bacteroidetes, and (D) Proteobacteria. # p < 0.05 and ## p < 0.01 vs. the normal group. *p < 0.05 and **p < 0.01 vs. the model group. Data are reported as mean ± SD. N: normal; M: model; S: fluoxetine; L: TIV-L; Me: TIV-M; H: TIV-H (n = 3 per group).
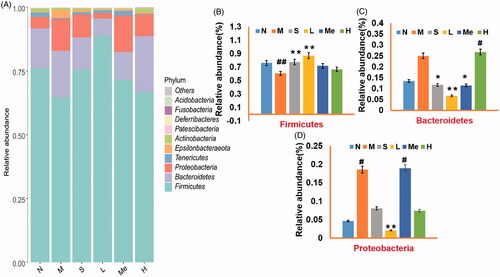
Figure 4. Comparison of microbial gene catalog of (A) Barplot of relative abundance at the genera level; the relative abundance of (B) Lactobacillus, (C) Bacteroides, and (D) Stenotrophomonas. # p < 0.05 and ## p < 0.01 vs. the normal group. *p < 0.05 and **p < 0.01 vs. the model group. Data are reported as mean ± SD. N: normal; M: model; S: fluoxetine; L: TIV-L; Me: TIV-M; H: TIV-H (n = 3 per group).
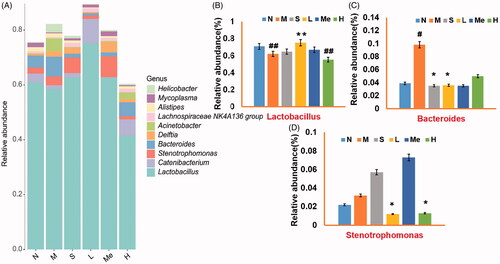
Figure 5. Heatmap of the relative abundances of (A) top 50 phylum and (B) top 50 genera. The red rectangle represents the relative abundance of the changed phylum and genera. # p < 0.05 and ## p < 0.01 vs. the normal group. *p < 0.05 and **p < 0.01 vs. the model group. Data are reported as mean ± SD. N: normal; M: model; S: fluoxetine; L: TIV-L; Me: TIV-M; H: TIV-H (n = 3 per group).
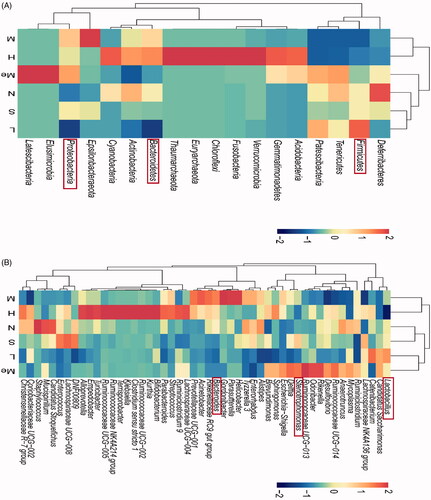
Figure 6. Comparison of metabolic function prediction of intestinal flora from TIV-treated CUMS mice and control group. (A) Relative abundance of carbohydrate metabolism. (B) Relative abundance of replication and repair functions. (C) Relative abundance of infectious diseases in mice. Data are reported as mean ± SD. # p < 0.05 and ## p < 0.01 vs. the normal group. *p < 0.05 and **p < 0.01 vs. the model group. N: normal; M: model; S: fluoxetine; L: TIV-L; Me: TIV-M; H: TIV-H (n = 3 per group).
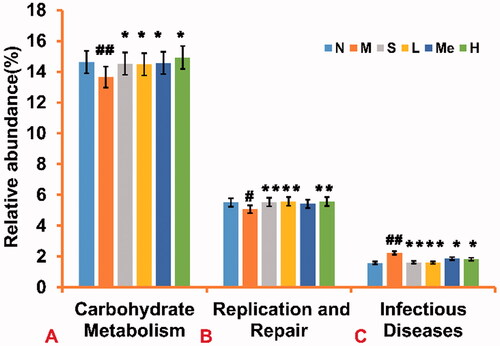
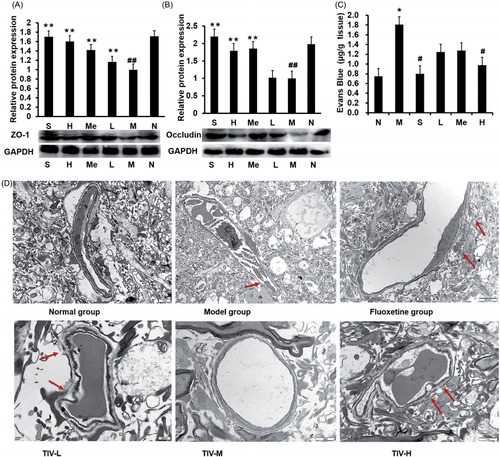
Figure 7. Comparison of BBB permeability and protein expression in TIV-treated CUMS mice and controls. (A) ZO-1 expression in TIV-treated CUMS mice. (B) Occludin expression in TIV-treated CUMS mice. (C) Changes in BBB permeability. (D) Observation of TJ ultrastructure changes in the BBB by transmission electron microscopy. The red arrow indicates a break or discontinuity in the basement membrane. Data are reported as mean ± SD. # p < 0.05 and ## p < 0.01 vs. the normal group. *p < 0.05 and **p < 0.01 vs. the model group. N: normal; M: model; S: fluoxetine; L: TIV-L; Me: TIV-M; H: TIV-H (n = 3 per group).